
Working on making SCOM a future-proof monitoring concept from the cloud.
We have been talking about a concept called Aquila for several years. Many of you would have heard about that. It is SCOM monitoring from the cloud, a cloud-SCOM. And since about a year, we have been looking at a preview version called Azure Monitor SCOM Managed Instance. We might use SCOM MI as a short way of calling it in this article. However, the full name is essential to the story.
There are several reasons why this version of SCOM came about. It would be too easy to say that everything Microsoft needs to be cloudy right now, however, I would call it one reason. But seriously, there are a few challenges we want to cover right here.
- SCOM is a very flexible and widely adopted monitoring framework with many possibilities. This also means that it is not as simple as a multi-ping tool. There are some things you need to know about the product to successfully design, install, and maintain it as far as the infrastructure side goes. For that reason, we have several TopQore SCOM trainings to learn how to do all this. The question arises if it is possible to take some of this away by using a Managed infrastructure behind SCOM. To make installation and backend configuration simpler and for example updates for the backend components and to do this from the cloud. Of course, for those who have the possibility to use the cloud as a resource.
- Many companies are going to the cloud and going hybrid (a good % on-prem and a good % in the cloud). When companies embark on a cloud/hybrid journey, we need to think about things like Manageability and Observability as well. When we move resources to the cloud, we need to be able to monitor them as well. For many, this is a point to think about what we need to monitor and from where and how. Azure Monitor has a great suite of tools available as the Microsoft cloud monitoring service. However, it is missing the extensive content of monitoring knowledge sitting in the SCOM management packs for over two decades.
- There are companies moving resources to the cloud through lift-and-shift methods as a first step in their cloud journey. This is a “relatively” easy method of copying a virtual machine across and running it in another data center (Azure). Usually, this step is followed by several applications going more cloud-native, but that is another story we will discuss in a webinar soon. When moving a machine to Azure, we think about monitoring it. Often, we want to monitor more than a simple set of counters and want to dive into the application layer again. And preferably use cloud methods for manageability. How are we going to support these customers?
This is where SCOM MI fits in.
We could have come up with a way to translate everything possible in normal SCOM into an Azure Monitor format with data collection, queries, workbooks, alerts, and so on. But it is a huge undertaking. Also, it is not necessary for every resource in the cloud to have the same amount of monitoring imposed on it. What was done is to make a choice to add a Capability to Azure Monitor for deep monitoring of applications running on your IaaS systems, whether they are sitting in the Azure datacenter or in the on-prem datacenter. Given that hybrid management is an important step forward in a hybrid strategy for manageability and more.
By adding SCOM as that additional capability to Azure Monitor, we are using the monitoring capabilities, the 25 years of management packs, and know-how for monitoring applications plus infrastructural pieces where they apply. We can use the existing product, with some changes of course, to do all this work for us.
We can run the SCOM MI in the cloud. And make the choices to make it relatively easy to design and deploy and to update/maintain the backend infrastructure of SCOM MI. Also, by making this run in the cloud, we can make use of some initial optimizations available there, such as running the backend on a SQL Managed Instance. This way, we are running a tool in the cloud, Integrated into Azure Monitor for extensive monitoring of some of our resources, making it easier to deploy and maintain, and make use of the years of management pack development.
Of course, this can only be a solution if there is an actual integration with Azure Monitor abilities. For example, to have alerts in Azure monitor, to be able to get data from SCOM to Log Analytics for querying and using workbooks and alerting mechanisms outside of SCOM itself. This way, we can consolidate data, or display it in other ways than previously possible.
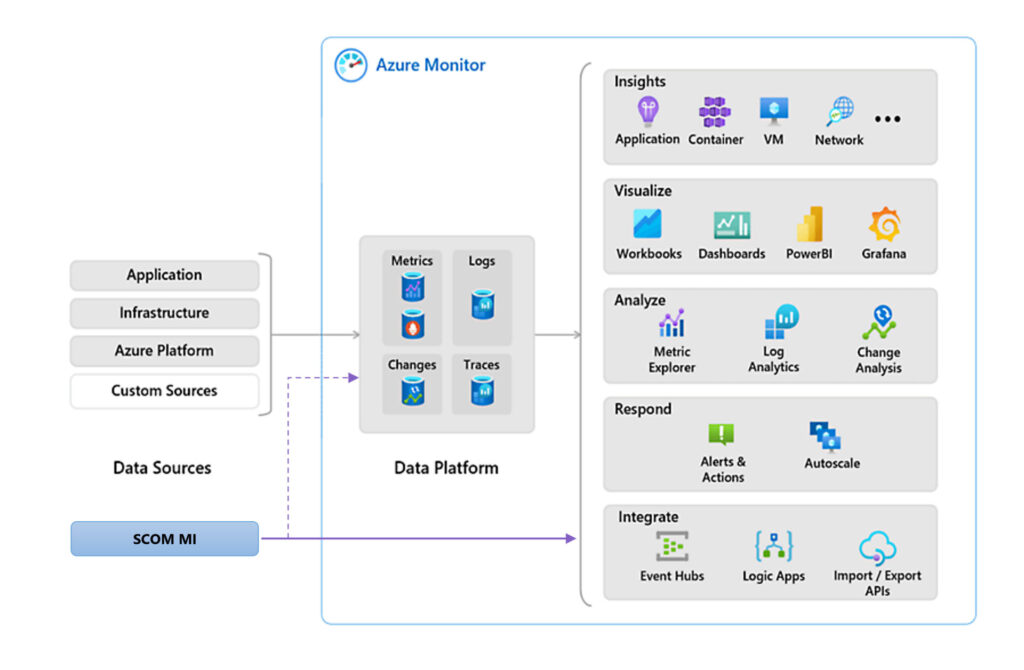
I am placing a picture from Microsoft in here to illustrate these points:
SCOM MI availability
Azure Monitor SCOM Managed Instance has been available for testing since December 2022 in a Preview. This has gotten several iterations in the meantime adding features and fixing things. As of writing this blog post – 15 November 2023 – the SCOM MI product will go live in GA (General Availability). This means we/you can start using it for production workloads as well.
Using the methodology of running this as a managed service and in the cloud, it gives the product team creating and supporting these products and features the option to adjust certain pieces, fix something, add a feature, and test features. This means that at GA time there will be some features available, which are in preview mode. An example of this is the experience of adding a managed gateway through the Portal. We will be able to add gateways in the old-fashioned way though. This way, we will be able to have a more continuous development going on with fully available features and some preview features. And the possibilities for those going into full mode quicker.
Also, we will see more efforts to make a transition between SCOM on-prem and SCOM MI easier from the start and going forward. This is looking at more guidance on how to implement SCOM MI, and how to move resources, management packs, and other components to the new SCOM MI instance. Also, work is being done on a migration wizard type of approach through the Migration Accelerator.
What is new with SCOM MI?
I am going to discuss a few items here, which were added fairly recently in the Preview version, and things from the GA version and some items coming soon – or which will be preview features of the GA product.
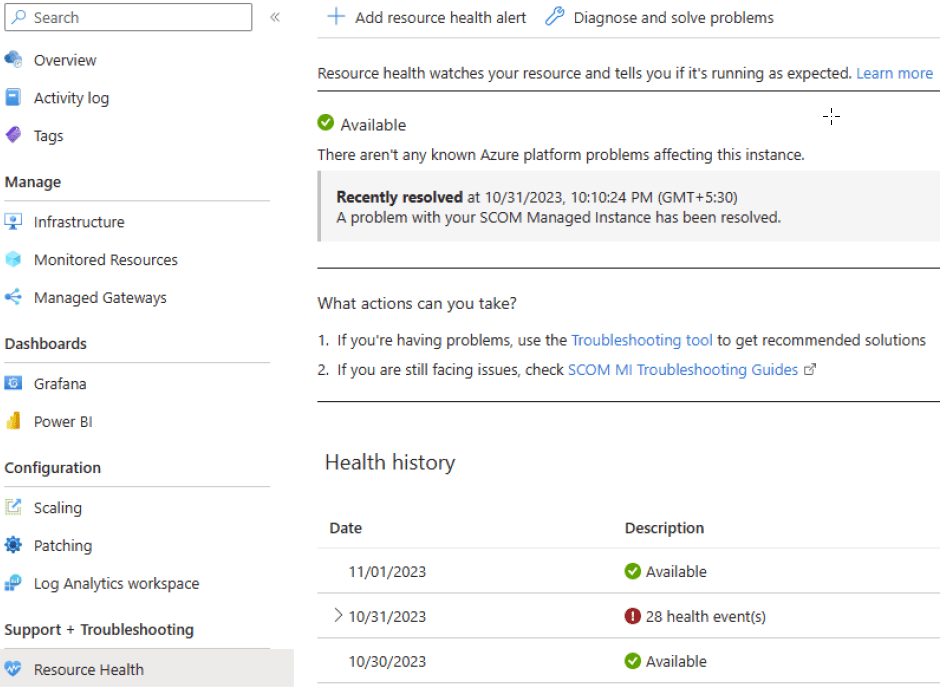
Viewing a Summary of your instance health
This is a view available since September 2023 where you can see the health history of your SCOM MI instance. For every day it shows either a green Available or it shows a number of health events.
Azure Monitor Alerts
Also, a feature available for a few weeks already is the connection to Azure Monitor Alerts. This makes it possible for SCOM MI to forward SCOM alerts into Azure Monitor Alerts.
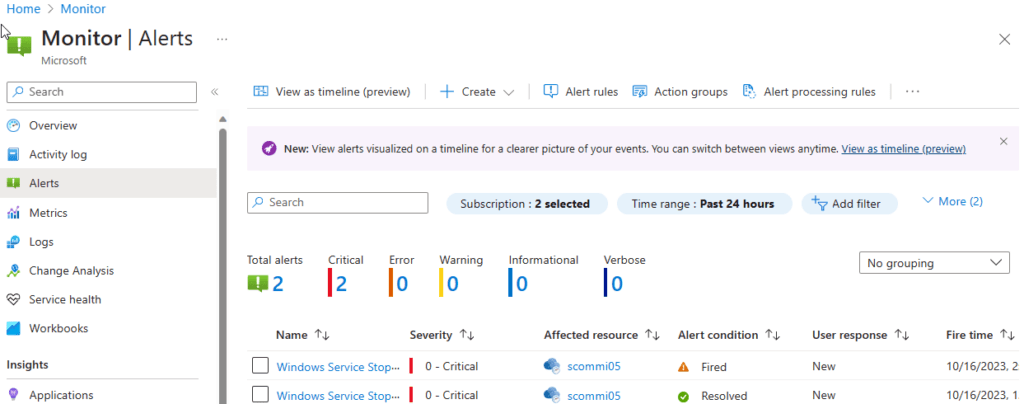
This means you can now see SCOM MI alerts (or multiple instances) together with other Azure Monitor alerts in one pane. You can open up such an alert and get more information regarding the information contained.
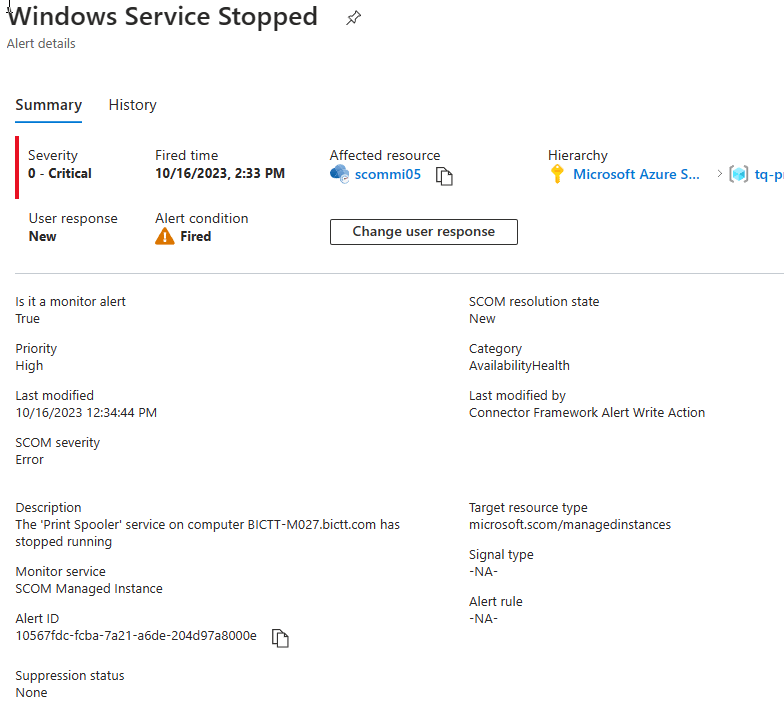
And from there it is possible to interact with the alert from the Azure Monitor side, such as to acknowledge it and add a comment.
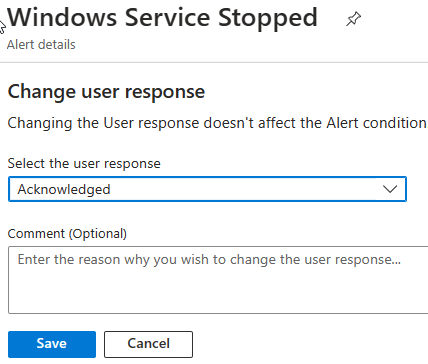
At this moment, this user response is not sent back to SCOM MI. It is something that might change in the future.
I subscribed myself to alerts from Azure Monitor to have them sent to my mailbox as well. Once you have monitoring data in Azure Monitor, you can use your cloud ninja techniques to access that data and work with it. The same goes for the next item on my list below!
Log Analytics Workspace connection
This is a feature that was added a month ago. This is your way of making the connection between SCOM generated data and Log Analytics and to forward data to your workspace.
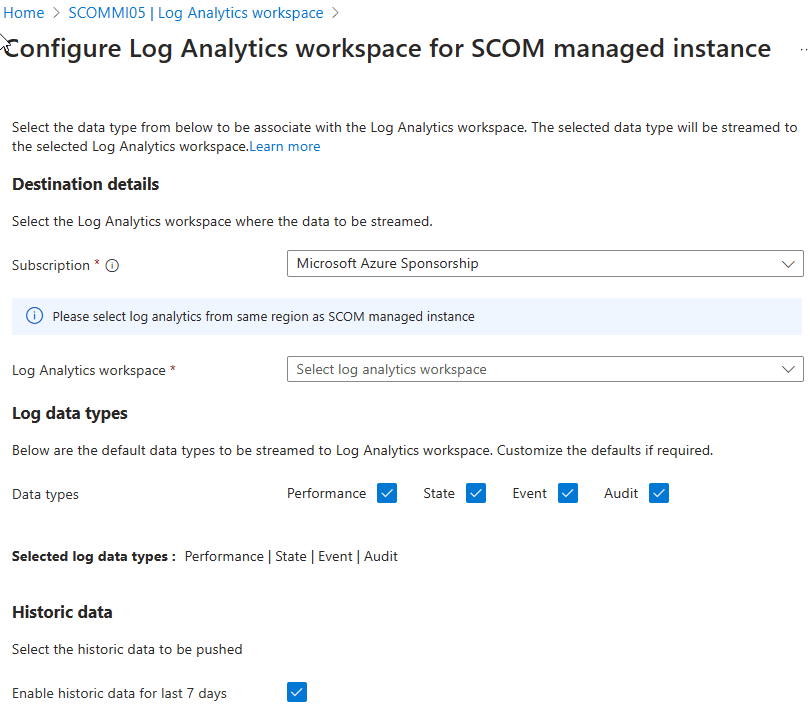
As you can see, you can select which workspace to send data to.
You select the type of data to be sent on, such as Performance, State, Event and Audit data. The Alert data was already being forwarded to Azure Monitor Alerts, remember? And one interesting addition is that option to push a week of historical data into your workspace from the start.
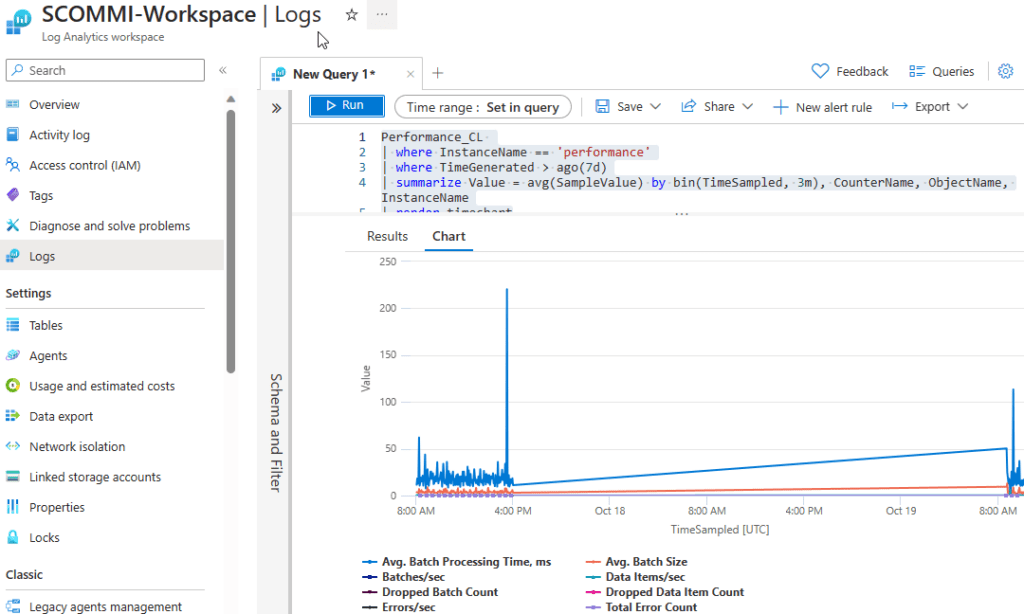
From here, we can work with the data to process it further. First, you can query data. This is an example where I just blindly get some performance counters and throw it into a graph:
We will soon however be seeing Workbooks appearing with more views and useful queries to view and work with our data. This also means that we will see the options enabled to grab and display data from Log Analytics with first-party and third-party dashboarding tools, which are made to talk directly to Log Analytics (Azure Monitor). But those workbooks are on their way soon, and of course, this has an opportunity for growth into more useful workbooks and so on, either from Microsoft or from the community.
This also brings us to another new feature.
Dashboarding with Grafana
As many of you are aware, when SCOM MI came to the cloud, the SCOM Reporting feature was taken out. There are a few reasons, which I will not into today on this blog.
For SCOM MI preview in the last year, this was in a small part replaced by making a connection to PowerBI and having a few views giving some insights into SCOM itself.
However, now a connection to Azure Managed Grafana is being made available.
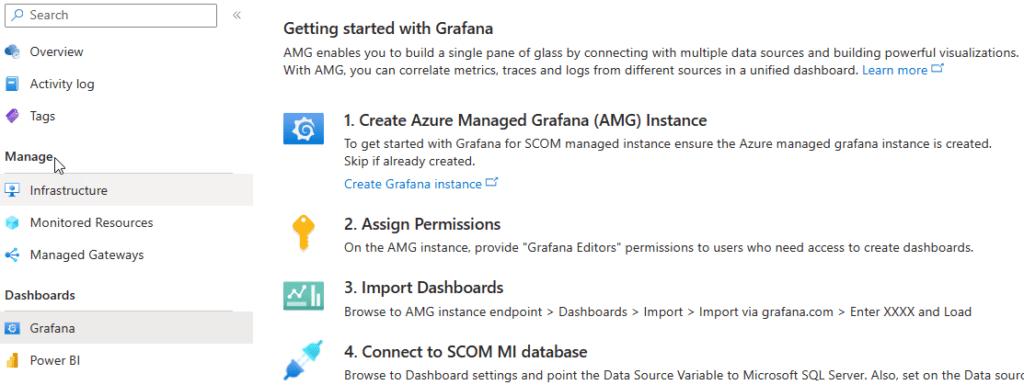
This is currently starting as a preview feature, while a more seamless integration is being built in the background. We are using an Azure Managed Grafana (A new one or an existing one), and connecting to the SCOM SQL backend. From there, we will start to see dashboards and views being made. For this purpose, this is just another SCOM connection.
I can envision perhaps Grafana and other dashboarding tools to later also start pulling data from the Log Analytics data that came from SCOM.
All of this is under construction, but it is clear where the possibilities are here for dashboarding and integration into the cloud mindset and integration with Azure Monitor and its surrounding ecosystem of tooling.
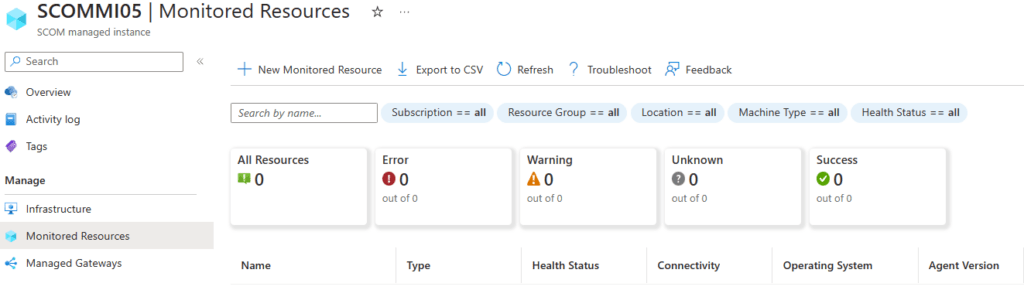
Monitored Resources
This is a new tab in SCOM MI. This is a place where you can deploy agents! To be clear, you can deploy agents in the same ways as always, through SCOM console, deploying a package in SCCM/MECM, scripting, manual install and so on. The tab in the portal is made to be able to deploy agents to Azure Managed resources. In this case we are talking about Azure VM’s and Arc managed Windows machines. So, this does not show all connected SCOM agents, but it will be a way to add agents through a VM Extension deployed through Arc. This also makes it possible for Arc to deploy updates to this extension to those machines.
Managed Gateways
SCOM uses gateways as a proxy to monitor agents or devices in the location where they are, such as an on-prem data center, for Linux monitoring on-prem, or a group of Windows agents in an un-trusted domain (untrusted by the SCOM MI infra).
Here again, you have two options.
You can use the same method as for normal SCOM to deploy a gateway server, and connect it up to SCOM MI, and manually handle any updates to the product as they appear.
Or you can use the Managed Gateways tab (see picture above, as it’s the same). Again, here you pick a machine that is available through Arc or an Azure VM resource. This machine must not have a SCOM agent or extension already installed. From here, you can install the Gateway extension to such a machine to make it work as a gateway in SCOM MI. This also means that updates to the product are also deployed this way, making maintenance easier.
Closing
Training
As TopQore we provide SCOM training at different levels from Operator to Administrator to Specialist. We also have a specialist training for SCOM MI available right now. The content is adjusted as features arrive. It is 1 day of training to get to know this product much deeper than we can cover in a single post!
Thank you
We have been working with Microsoft behind the scenes with feedback, testing, prioritizing, helping, motivating, and eating ice cream for several years and enjoyed very much to see this come to life. There is much more to do, and we will be there! Thank you Product Team!