

As part of the SCOM Reporting blog post series, we are talking about some of the useful reports. In this post we will have a look at the Operating System reports.
There are a few to look at. First of all there are these types of folders relating to a version of Windows, but the reports in it are basically the same:
Some of these reports can also be accessed from the state views in the monitoring pane as shown in an earlier post in this series.
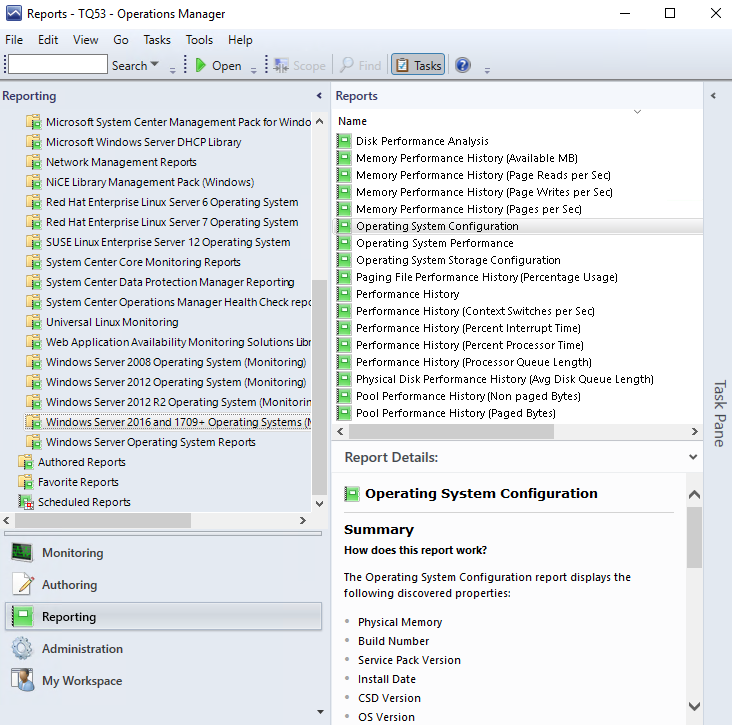
As you can see there are a number of reports having to do with performance of CPU, Memory, Disk and such. Have a look through those and determine what could be useful for you. There are report details descriptions at the bottom of the screen.
Another example is this Operating System Configuration report, which gives a look at the discovered inventory, properties of the class objects found for the class Windows Server Operating System.
There is also another folder in this reports list “Windows Server Operating System Reports”:
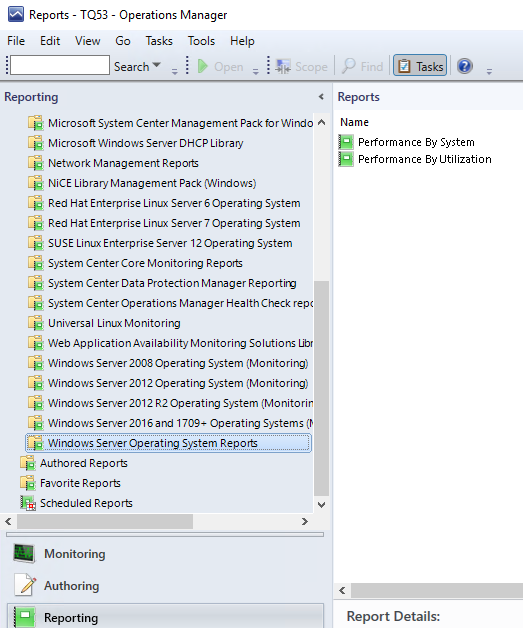
This has only two reports in it, but you will find them useful. Let’s have a look at both of them.
The first one is Performance By System:
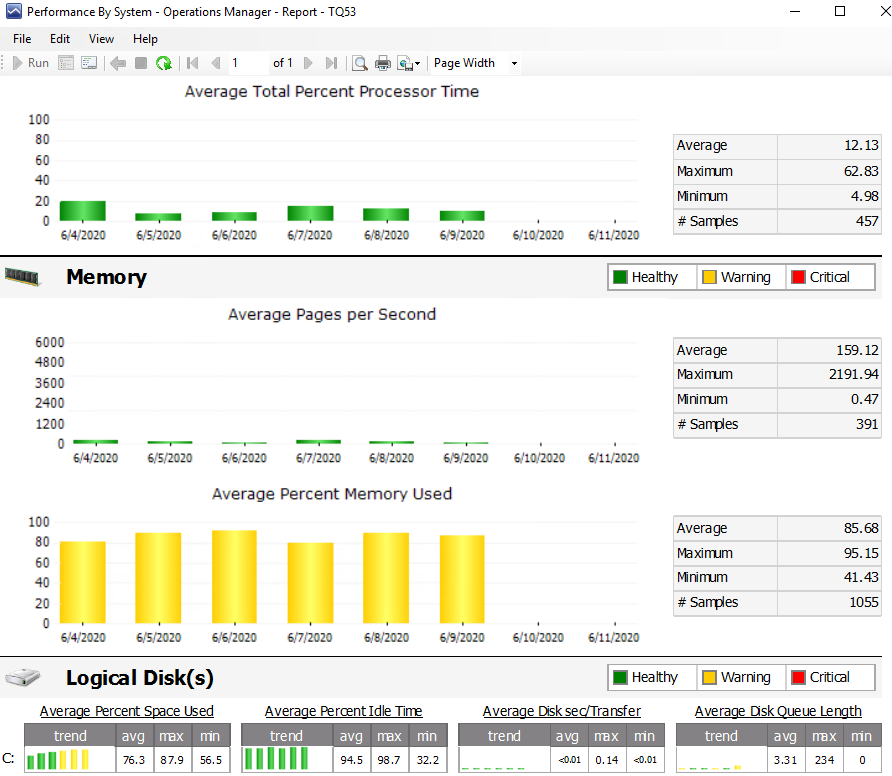
This is a cut-out of this report targeted at one server with a selection of 7 days of data. As you can see the report has space for 7 days of data in it. If you select only 1 day of data you can not see those bar charts next to each other, so it would make sense to select a few days.
You can see there are multiple graphs in the report, all pre-prepared for you. You can not change much in the layout, but I find it very readable and gives a trend across the week and shows some numbers at the sides. Processor, memory, disk, network. A very useful report to show some base metrics for a server. You can simply schedule this one.
Next I want to show you the “Performance By Utilization” report:
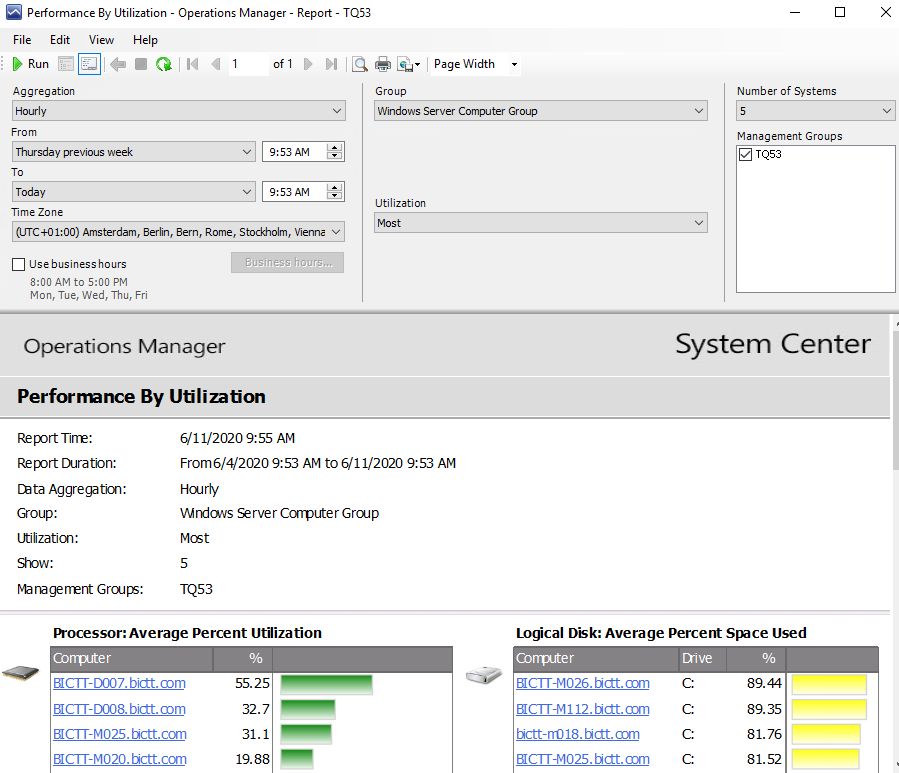
I left the parameters selection screen open on purpose here, so you can see it.
I selected a week of data, Went for the Windows Server Computer Group to get all of my servers (not that many in the demo environment obviously). Selected the Utilization – Most option to show the highest values of each counter. And the number of systems I wanted to see in the top-x tables.
Now below it if you run the report you will see a number of tables with different counters relating to a few counters for Processor, Memory, Disk, Network.
And as you can see it simply shows the top-x servers with the highest utilization of each counter separately.
It is very useful to be able to determine who are the machines with high utilization of these counters, because you can then do something about it. By finding out if a process is doing more than it needs to do, by finding resource hogs, or by finding out your capacity management for some machines needs to add resources to some of the busy machines.
Likewise you can also select the Utilization – Least option in the parameters to find the machines using the least of these resources. That might mean they have nothing to do, or they might have too many system resources assigned to them, so you could claim some back in capacity management.
In all, the reports coming with the Windows Operating System management packs, but also with the Linux Operating System management packs are very useful to have a look at and use.
Back to the master list: SCOM Reporting series – Home and What is SCOM Reporting