

In this blog post series about SCOM reporting, this time I want to discuss a very useful report for SCOM Admins especially. For other stakeholders this will be less interesting. It is pure SCOM specific, but gives a LOT of information. The report I am talking about is the “Data Volume By Management Pack”. I highly recommend each SCOM Admin to run this report regularly (Weekly for example). Let us have a look at this report and some of the things it shows us.
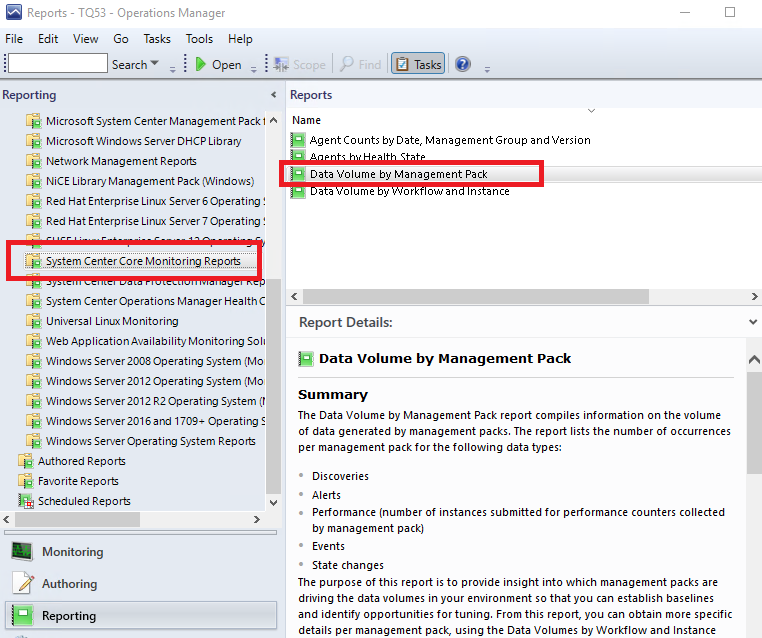
In the figure above you can find the location of the report in the folder System Center Core Monitoring Reports. There are other very useful reports in this folder, but we will focus on the Data Volume by Management Pack in this case.
Double click the report and change the time frame. For instance Yesterday to Today. In My case I took Today minus 7 days until today to get a weeks data (small demo environment).
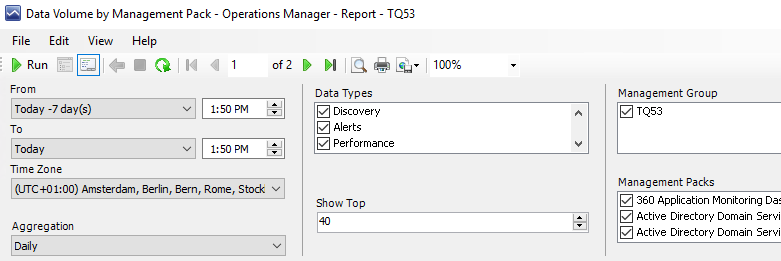
Next in the middle of the report wizard you see Data Types and Show Top. I usually start with not filtering the Data Types for a first look at the report. After that I usually make choices in that list to focus on Performance or Events or the other choices. Reasoning here is that usually the amount of performance counter entries is so much higher than all other data that the top-x in the list only reflects the amount of data collected in performance counters. If you de-select that data type you will see another top-x listing to work on. We will see this later. The Show Top field I usually set to 40 or 50 entries, so I get a feeling of what is going on. Lets run it.
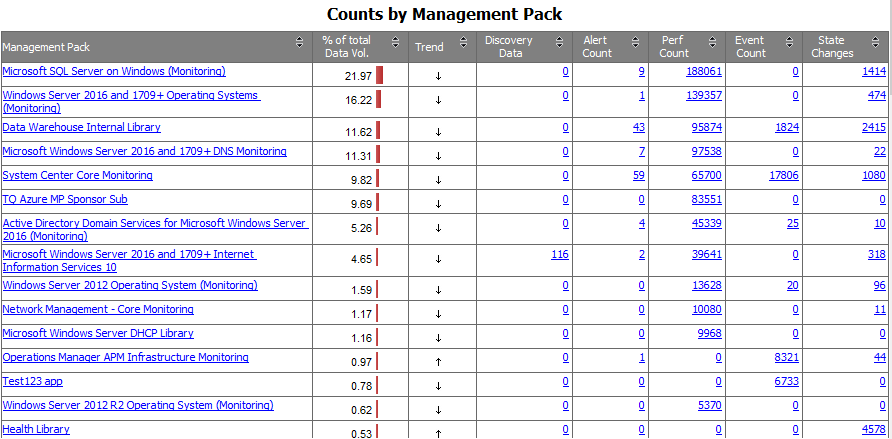
This is a screenshot from one of our demo/test environments.
The first question you should ask yourself here is always a Why?
The different columns give other types of reasons to look at these. In short:
- Performance and Events have to do with the amount of data in the database, causing large databases and a lot of data flow. You can ask yourself if you need all this information, if you view and report on these counters and events. Some performance collection rules might be turned off if they are not needed or you can change collection intervals.
- Discovery Data, Alert Count and State Changes. This has more to do with what we call Config Churn. Even though the numbers in these columns are lower than Performance Counters, they are very important regarding the performance of SCOM, the management servers and the SCOM console or other dashboards. Of course Alerts will be very visible to SCOM Operators and if they are linked to incident management as well. Also a few core management packs are in this report for this reason.
This report is very valuable for tuning management packs, but also for finding issues or potential issues affecting either capacity, management server performance or visible and less visible issues or slow downs of SCOM and impact on the users of SCOM.
As you can see in the figure above you can click on the numbers in the table. Let me click in the performance column on the Windows Operating System pack entry (second in the list above).
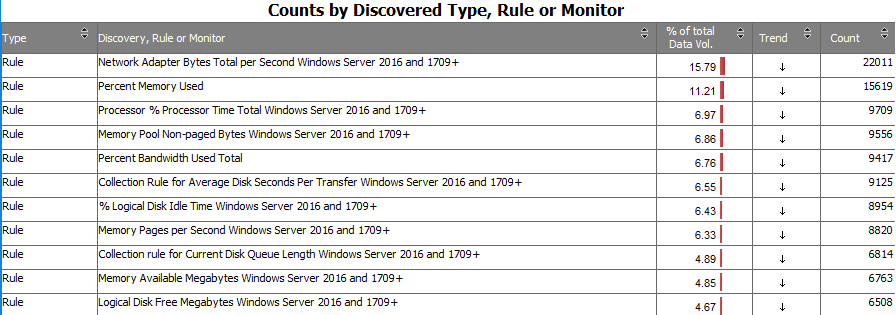
This shows a list of in this case Rules and names of the rules collecting data. It shows the percentage of data volume within this pack for each rule and number of data points.
From here you can think about if you need some of these counters to be collected, or if you feel that the amount of data is too much you could change the collection interval on some counters. Changing the collection interval from 5 minutes to 10 minutes effectively halves the number of data points. Also now you can find the correct rule names, because that is not always obvious in naming convention.
Going back to the main report and zooming into the Events column you can also ask yourself if you are actively using this data. If you are never using the event data to look back (using SCOM) or reporting on it, maybe you can turn off the collection of those. Especially the Operating System packs can collect lot of events, sometimes in the millions per day if there is something wrong on some of the machines on the network. You can also keep those turned on, but I suggest in that case to look at those on a daily basis. You can zoom into that from the main and schedule the child report. It can indicate machines having problems with services or drivers crashing sometimes every second and thus rendering the monitored server useless and sometimes impossible to even login to. You will want to fix that for the reason of fixing an application server, and also for the amount of collected data it results in SCOM databases. Act on it or turn it off.
Now, if we turn off the Data Types for Performance and Events, we see this in the same report:
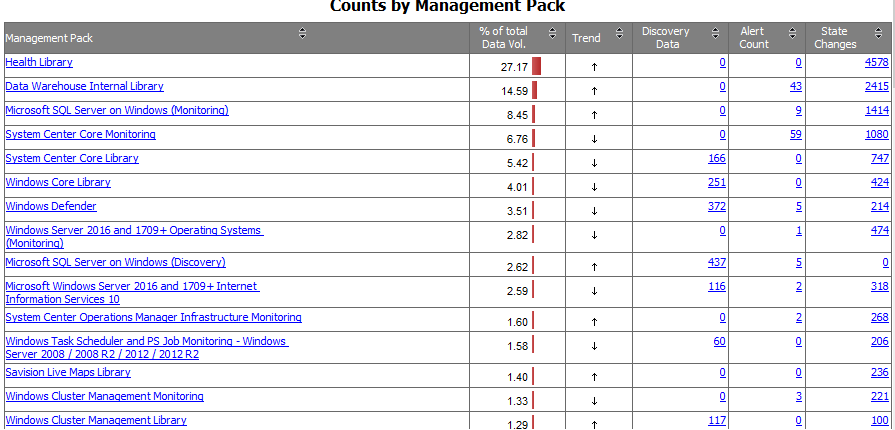
These 3 columns have to do with config churn. Normally there are not that many items in Discovery Data. This is because you are not adding many servers and websites each day (I assume), so not many new objects are discovered. If you see a high number in there, it could be a management pack with a wrong configuration. In the past we have seen discoveries with a counter used as a property. That changes every time the object goes through re-discovery.
Alert Count is something simple and you know this looking at the SCOM console. However, there might also be alerts you do not see. For example if they happen during the night and they close again before you get back into the office, or if these alerts are not forwarded to ticketing or email, or if they open and close within a minute. SO it might still be useful to have a look if these numbers are what you expect. And of course zooming in you find what most common alerts are and so on.
The State changes have to do with Monitors in SCOM because they hold state. A state change in for example an object in SQL (third line in the figure above) will result in a state change on that monitor. However it can and will also result in changes of state moving up the health tree, from database file to database to db engine to server and several rollups in between. Those rollups and so on result in the more generic packs showing up in this list for state changes. So you do not have to zoom into those much because they will simply reflect rollups and such. But you can image that SCOM has to calculate through all those state changes and thus many more rollups and parent class objects and perhaps dashboards. This causes a lot of work for the SCOM infrastructure. So check which are the state changes causing the chain of state changes (SQL Pack, OS pack, IIS pack, Defender pack in my example case). If you solve those the resulting config churn change makes a big difference. And if it causes alerts as well or state changes on an important business dashboard even more visibly as well.
As you can see, there are many reasons why this report is important to a SCOM admin and as the SCOM admin works on it, it will also result in better results for the business whole. By finding problems, and by tuning SCOM and thus its performance.
Back to the master list: SCOM Reporting series – Home and What is SCOM Reporting