

In this post in the SCOM Reporting series we will discuss running the first report. We will use a basic Performance report as an example and we can use this example in later blog posts in this series, for example the Exporting/Saving/Scheduling reports sections coming up.
For this example I created a management pack where I will store configuration data related to monitoring of “Application XYZ”. I created a group called Application XYZ Computers and saved the group in this management pack. I made a few Windows Computers in my demo environment a member of this group. Now because at first we are looking at base reports, I do not have to create custom monitors or anything like that. Now I want to have a performance report of these servers and I am beginning first from the base report mentioned in the previous post in this series. Later I will show you another useful example and link it at the bottom of the page.
The report I am going to use as an example is not the easiest one, but it is a very flexible one. There are some choices to be made. If you select reports which are ready-made for a specific purpose, there will be less choices to be made and the report will be less difficult to run. Do not worry however. Feel free to play along with the example.
Lets start making something…
Open the SCOM Console and go to the Reporting Pane.
Select Microsoft Generic Report Library in the menu to the left and select the Performance Detail report from the list in the middle of the screen.
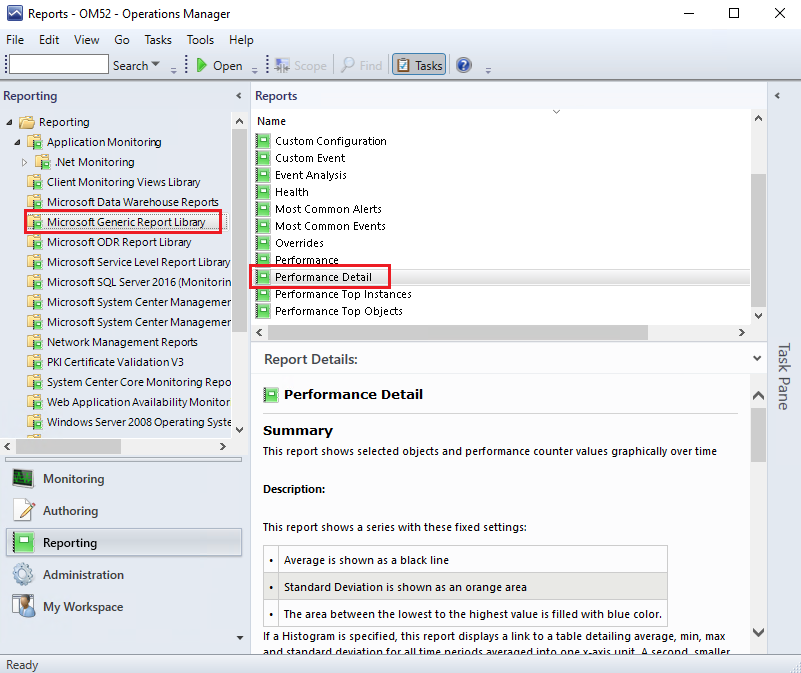
Note at the bottom-middle of the screen you see the Report Details. In this case there is an explanation telling us what it is used for, that there are additional lines and areas in the report and what they mean and some example usage entries below that. Since this is a very generic report you can place any object in there with a performance counter to show. In other reports there is often a statement telling you what types of objects to put in the report (a computer, a database, a website, a disk, etc.).
Now double click the report in the list to open it or click Open.
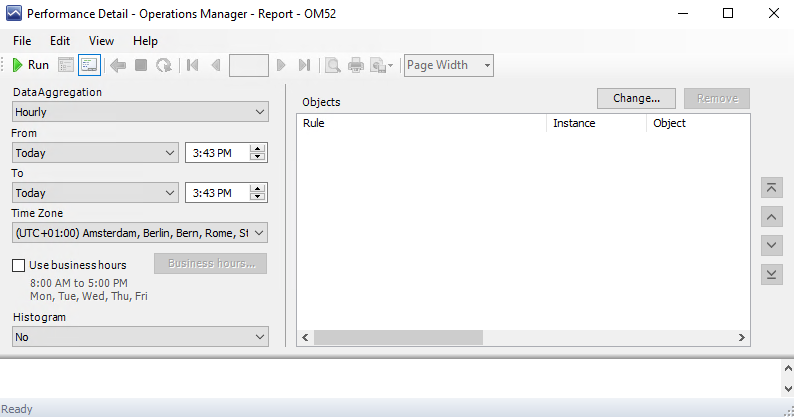
You will see the above figure. We need two basic things here: We need to know what timeframe we want the data for, and what the objects and counters will be.
Let’s first take care of the time, which is on the left hand side of the report wizard.
Data aggregation is going to be Hourly or Daily, depending on what you are looking for. If you are running reports over the course of a day or week or up to as month you can take the Hourly aggregation to get enough data points. If you are running reports across an extended period of time like a quarter or year, you might want to select Daily aggregation.
Next are the From and To fields. You can do nice things with these, such as selecting specific dates, but also relative dates like Last Week or Last Month. This is often used in monthly reports where you select first Previous Month First Day in the from field and Previous Month Last Day in the To field. Relative dates are useful because it means we can later schedule this report to run on the first day of every month and it would pull in data from the month before it. If you run a report for the first time I always change the From field to Yesterday and leave the rest of the fields default, so I get a report from the last 24 hours.
I will select the times of day as well, so I will schedule it for 12:10 AM to 11:50 PM to cover the whole days of the first and last days of the month. Time Zone could be applicable if you are running reports for a day and if you have to deal with counters in a central database for servers all over the world.
The Use Business Hours button is often useful for KPI indicators and availability reports, whereby we might only be interested in the values during business hours. The night there might be maintenance, backups, scan job, automated jobs, and nobody online. So you may have this requirement to put in only office hours on business days.
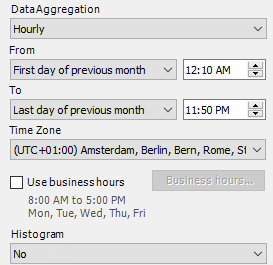
In my case this is the result.
Next we need to pick which counters from which objects we are interested in. We do that by moving to the right hand side of the report wizard and clicking the Change button above the Objects section.
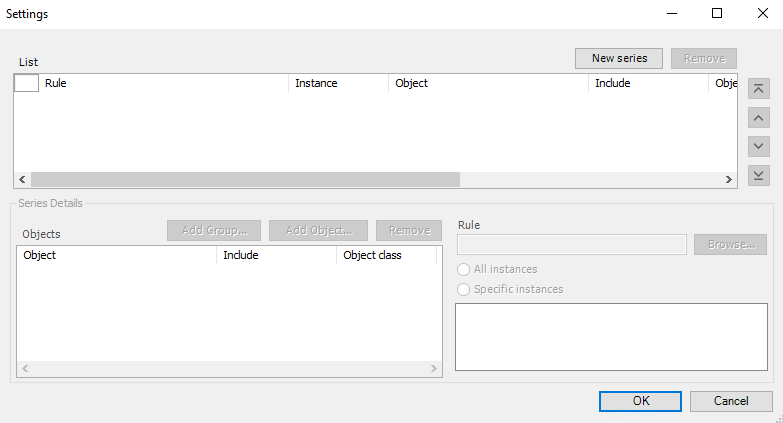
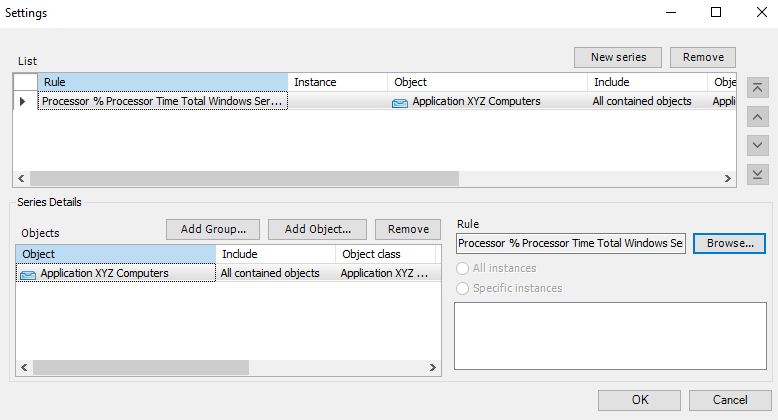
This can be a confusing area of the wizard. What we are asked to do is create one or more performance graphs. And select for each graph which objects to put in there and which counter. These are the three areas in the wizard here. Lets start.
Click the New Series button at the top. Click the Add Group… button which becomes available at the bottom.
The Add Group wizard pops up. In the search area at the top I type Application XYZ Computers and Click Search. If you are playing along you could try the group called All Windows Computers, but keep in mind that in large environments a lot of servers could be in there, so running a report across a large group of servers/objects might take some time. After clicking the Search button I see in the middle of the wizard at Available Items it found my group and I click the Add button below it to add it to the bottom field of the Add Group wizard and click OK. This brings me back to the earlier wizard and I now focus to the right-bottom part where it says Rule and I click Browse…
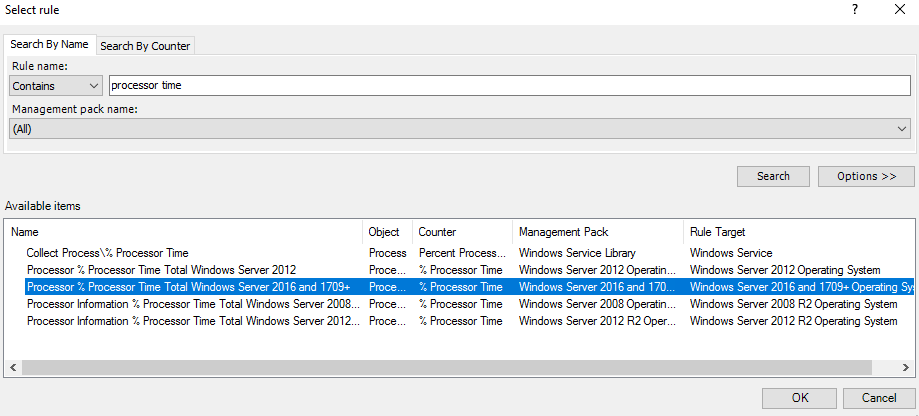
As you can see from the screenshot above I went to find “processor time” in order to find the rule which collects my CPU usage on the servers. So I types Processor time and clicked the Search button to see if I can find the counter. As you can see it gives me 5 results and I have to find the one I need from there. In this case I want to have the counter for the Windows 2016 operating system and make good use of the columns there to find the one you need. You can see the name of the counter and rule, but also the management pack it is coming from usually gives a good hint and what is also good to keep in mind is the Rule Target. Because this target must be in whatever group or object you chose in the step before this. Windows Server # Operating System is a class below the Windows Computer class which are in my group, so this will be alright. For your case and environment, look for an applicable counter which will suit you. It might be different from this screenshot depending on the management pack version you have loaded in SCOM. Click the OK button to confirm the selection of the rule.
Now I have all 3 fields entered in the series I can move on. Of course you can add multiple series here and select other groups or counters. For now 1 series is fine with me and I click OK.
Back in the Report wizard itself there is a Green arrow saying Run. Click that to actually run the report with the selected options. Give it a minute to run.
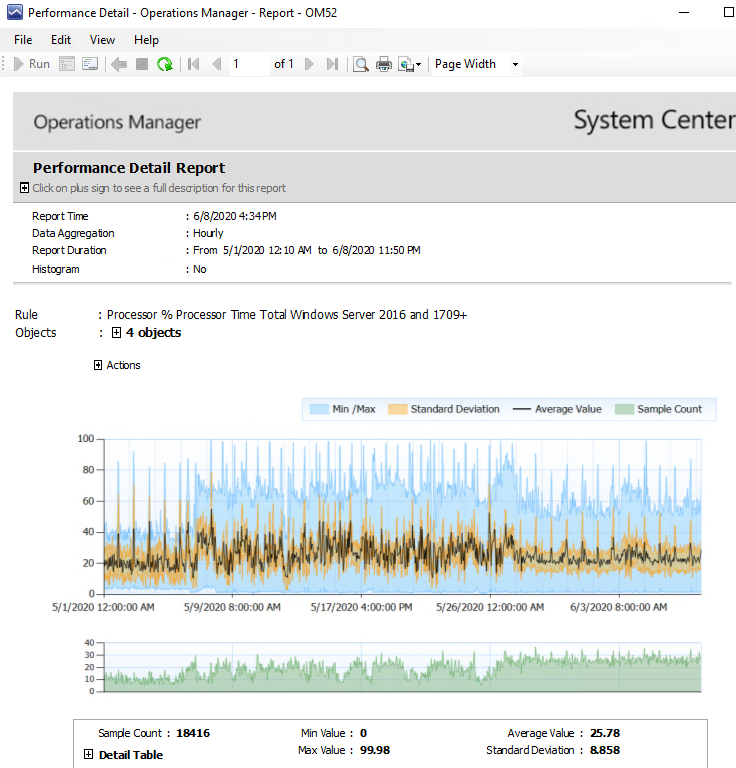
So that gave me the above report. And yes I know I forgot to select Previous Month Last day there and just left Today in the To field in the date selector. Ha ha ha.
What we can see if a section where it states when the report was run with which time options.
We see the Rule used for this series and it says 4 objects in this case. If you click the + plus symbol next to it you will see the 4 machines which happen to be in the group I created.
After that you see the graph with a black line and yellow and blue areas.
Below that is a green graph and detail table showing you how many data points this graph is based on and how many data points there were over the time period of the report.
Now this is a graph for 4 machines at the same time, so that average line hovering around the 20 to 40 percent CPU is the average across all 4 machines at the same time. I always have these kind of higher level reports first to check if there is anything out of the ordinary. The Performance Detail report will do that for me because it gives more than just that average line. From the Blue and Yellow areas we get statistical information. Especially if I see the blue area there I can see at least one of the machines at nearly every point in time was near the 5% in CPU or less and also we see an area where at least one of the CPUs was in the 60 to 80% range. SO it might be interesting to investigate further for this set of servers which ones are under utilized and which ones have a harder time, so we can act accordingly by perhaps adjusting the virtual hardware specs of these machines.
For a look at how this report can be used for reporting performance across large groups of servers in often-changing datacenter environments, we had a blog post years ago: SCOM Reports on performance counters for large groups of servers. The problem in those types of environments is often that auditors or managers want to see performance graphs every month in a report, and within a month time there have been several servers removed or added and you need to try to adjust the report every month to add or remove those servers from the report. Of course this is manual work and gets forgotten as well, so the blog post explains a way to handle such a situation. Not completely automated either, but it sure saved me some time before.
Concluding
SO we took a report from the Generic reports library and selected the time period the report should cover. We selected a group of targets and a performance collection rule containing what we were interested in and ran the report. And we saw a result there. Congratulations!
After this you would generally either Export (Save) the report, or save it for later runs, or schedule it to run automatically. All these options will be handled in future blog posts in this series. They all start from this point: You selected the report, selected time and objects, and you ran the report and it shows data. And the report is open in your screen that way. So if you want to follow any of the guides in those other posts you can do that from here or run any other report to the same point. As long as you are looking at a report with data in it.
Back to the master list: SCOM Reporting series – Home and What is SCOM Reporting
Comments are closed.