As I said earlier I was not able to attend a few SCOM CEP meetings and did not have the time to blog about the fantastic features the new System Center 2012 Operations Manager is sporting. But as I was writing already anyway, I can give it another go. So the CEP meeting at the beginning of November was about Network Monitoring, one of the great new additions to SCOM.
Well, of course there was network monitoring before in SCOM and of course a number of community and third party solutions who have been doing great work for years now in extending the product to cover network monitoring!
This CEP session was presented by Vishnu Nath.
So what’s this network monitoring all about?
Well, we now have out of the box discovery, monitoring, dashboards and reporting with multi-vendor support. Protocol support for SNMP 1 and 2 and 3 and IPv4 and IPv6.
The network device discovery wizard has had a serious update.
So what things are discovered for devices?
Components of devices, such as ports and interfaces, processor and memory. Connectivity between switches and to servers. VLAN membership and HSRP groups.
A fun part of network device discovery is that you are not limited to only explicit discoveries, but you can also do a recursive discovery whereby the probing passes from one device to the next based of course upon the given boundaries you provide.
The default is that network ports are monitored which are either connected to another network device or a managed server. It is possible to include more than that.
Also in the field of visualization there has been a major effort. There are network dashboards taking advantage of all the new dashboarding features and more.
The network summary dashboard points you to top-using nodes and interfaces, sorted by usage so you are quickly pointed to the items where you can expect the most issues.
The network node dashboard shows graphically what is going on with the devices, such as its location in the vicinity view, usage statistics, properties of the device and performance statistics.
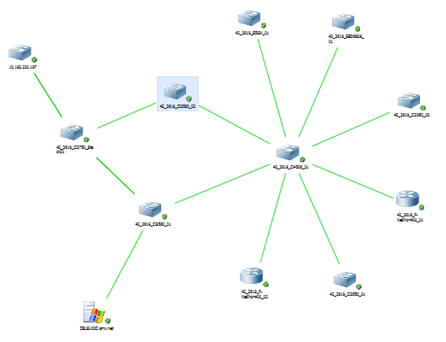
The vicinity dashboard shows you the network devices in a connected network. Drawing lines between the monitored devices. Nice to finally have a topology view. It is possible to toggle a setting to also show connected servers to those devices. How nice is that, huh?
The network interface dashboard shows properties and statistics on the interfaces.
Reporting has memory, processor and port reports just to get started.
Enjoy!
Bob COrnelissen