
When it comes to monitoring, standard metrics and built-in checks often provide a great starting point. But what if you need deeper insights tailored to your specific environment? That’s where SQL custom query-based monitors come in.
Although SQL Custom Query-Based DB Engine or Database monitors had been released with version agnostic SQL management packs long ago, I did not have much intention to use it since I was preferring to use either VB or Power Shell based scripts to create SQL Query based monitors till one of our customers requested help regarding to it a few weeks ago.
These monitors have three basic settings to be defined.
- SQL Query
- Conditions
- Property Bag
For SQL Query as you might imagine you form a query which gives you the dataset that you will run your conditions against.
According to your dataset you will be able to form your conditions and define a healthy and unhealthy state.
And lastly you will define the items of property bag which will include information you need to be either displayed or added to the notification when you have an alert or a state change
Lets start. Our goal is to create a monitor that will fire an alert when a specific row is added to a database.
Instead of using a separate database I thought I could use SCOM itself. As you know every alert is inserted into a table and those alerts can be accessed through view called AlertView which I will be using. You can use any alert in you environment that you can easily create but I preferred to have a Windows Service Monitor named “TopQore Spooler Service Monitor” as follows.
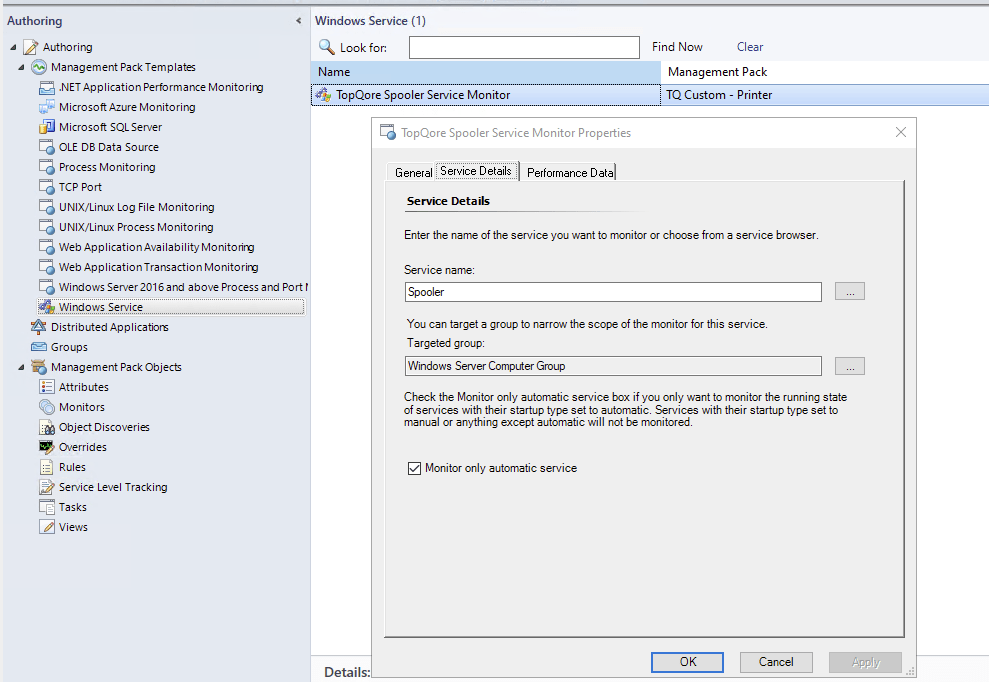
This is to easily create a row in Alerts View within OperationsManager Database. Now that we have a monitor for Spooler Service and we can easily create an alert by stopping it.
Shortly stopping the service the alert is created and a record is inserted in the database where we will get the Name to form the final query
SELECT [TimeRaised], [MonitoringObjectName], [Name] FROM [OperationsManager].[dbo].[AlertView]
order by [TimeRaised] desc
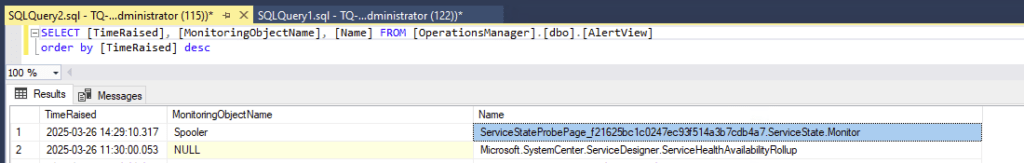
Now that we have the name of the Monitor we can build the query to search an alert for this monitor
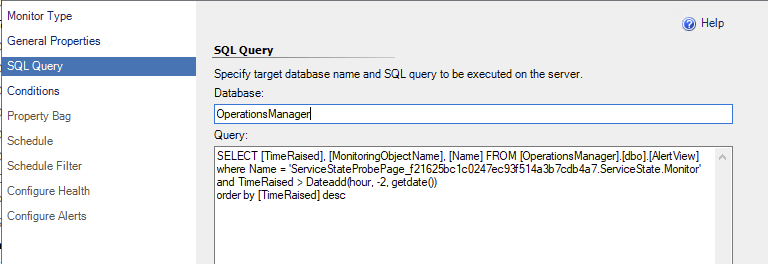
SELECT [TimeRaised], [MonitoringObjectName], [Name] FROM [OperationsManager].[dbo].[AlertView]
where Name = 'ServiceStateProbePage_f21625bc1c0247ec93f514a3b7cdb4a7.ServiceState.Monitor'
and TimeRaised > Dateadd(hour, -2, getdate())
order by [TimeRaised] desc
This is the query to find if a specific row is added to a database as set in our goal above. This way we can easily demonstrate a row insertion by only stopping Spooler Service.
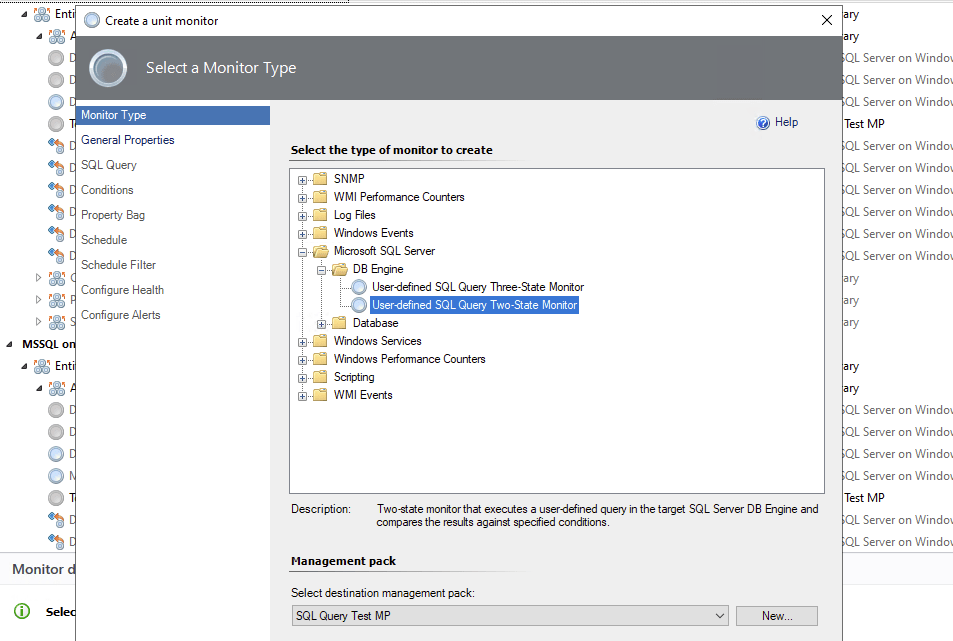
Now that we have our query we can start building our SQL Custom Query Based DB Engine Monitor.
We start choosing the Monitor Type as Microsoft SQL Server > DB Engine > User-defined SQL Query Two-State Monitor.
After filling the General Properties it is time to set the Query with the one we have previously created targeting it to the OperationsManager database.
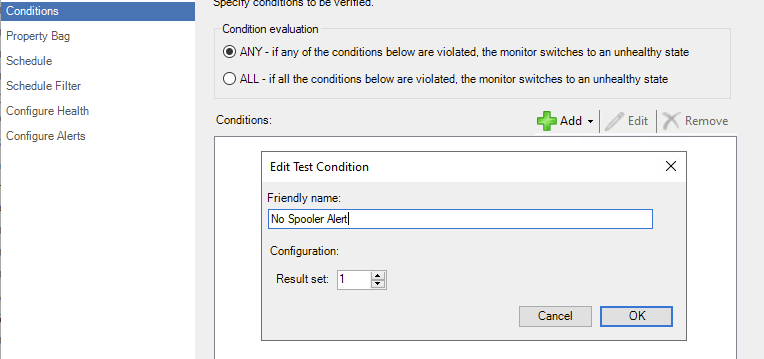
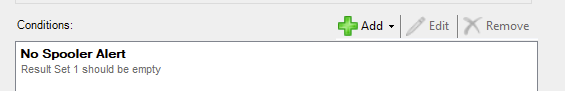
Set the Condition as ANY and Empty Result Set
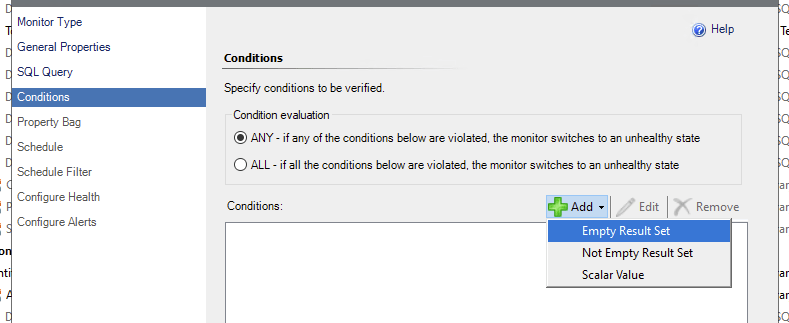
This was exactly the place where I had confusion because Condition Evaluation had an explanation of “if any of the conditions below are violated, the monitor switches to an unhealthy state“. This made me think I should write a condition where the alert would raise but it was the other way around. That is the reason why we Add a Condition to have an Empty Result Set meaning the monitor will be Healthy as long as the query creates an empty result set
As we have said we would like to add the columns and information we need to property bag. Since we have TimeRaised, MonitoringObjectName and Name columns in our dataset we can choose one or more to have them into our Property Bag
We definitely want to have the MonitoringObjectName and Name fields. We can either give the Column Name or the Column Number according to the result set. Since have 1 result set and we want to have the latest record we set the Result Set and Row Numbers to 1 and Monitor Name is in the last column we set it to 3.
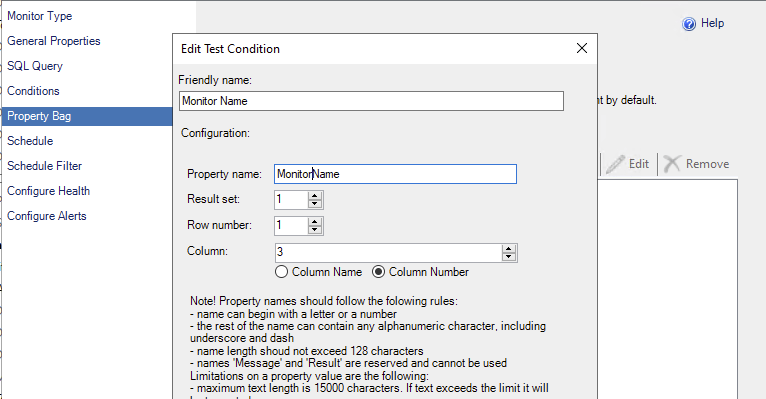
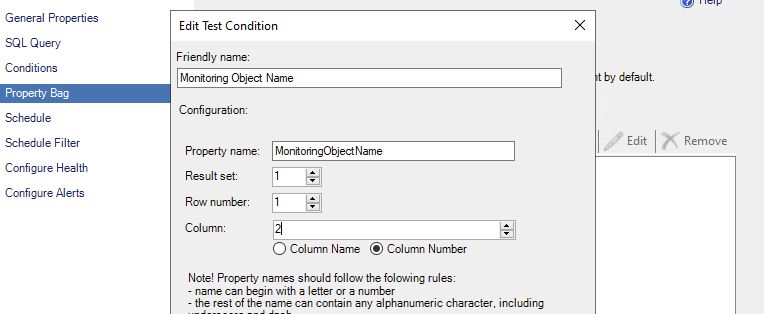
Here, the Property name field is important because this is the name that we will use within the notifications in Alert settings.
After setting the Schedule, Schedule Filter and Configure Health, we can configure the Alerts to include our Property Bag as follows;
An alert is raised by a monitor named $Data/Context/Property[@Name='MonitorName']$ which is related to $Data/Context/Property[@Name='MonitoringObjectName']$
with the message $Data/Context/Property[@Name='Message']$
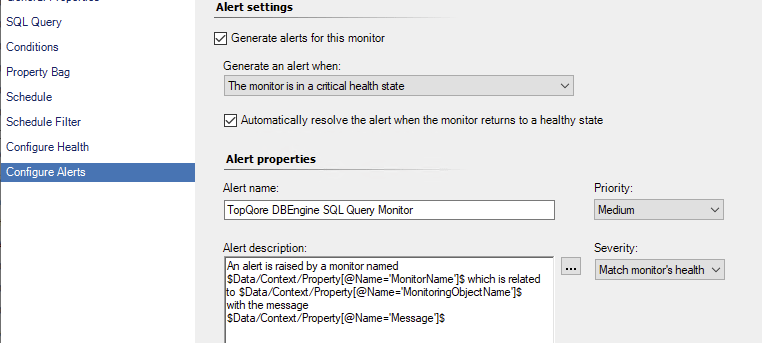
As you can see we put the property bag items in the same way with the names we defined. Message is the default property bag created and the name is reserved as stated in the Edit Test Condition window.
After waiting for a few minutes and stopping Spooler service on the server, we get the following alert which is what we were targeting.
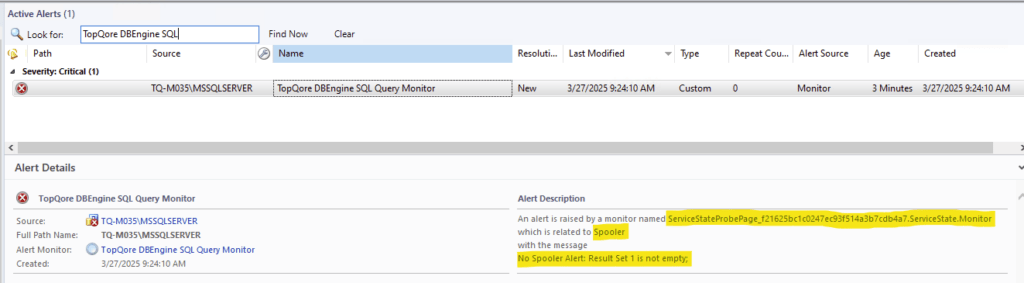
As you can see, after understanding how the monitor, query and conditions work, it becomes easier to achieve the result we are aiming for. Since this solution does not need any username and password to be given within a script it is better in terms of security but there might be cases where you would have to use a script to evaluate much more complex conditions.