
This is a continuation of my notes on the fourth SCOM 2012 CEP meeting in Dashboards. The first post on this can be found here.
Ake Pettersson followed with demonstrations of out of the box dashboards that are upcoming or already there.
Three main out of the box dashboards:
- network monitoring dashboards
- management group health dashboard
- service level dashboard
The SCOM team is working with 16 internal product groups to extend the existing MP’s with dashboards. They will be aiming for consistency in UI Design and Styling best practices, also by using templates. Those dashboards will come with management packs (through the catalog).
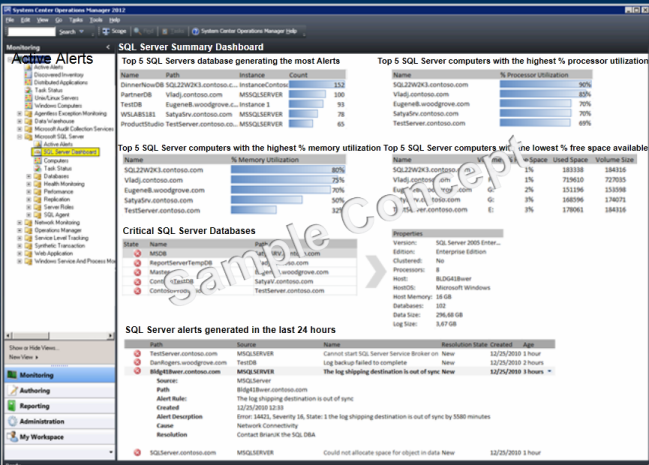
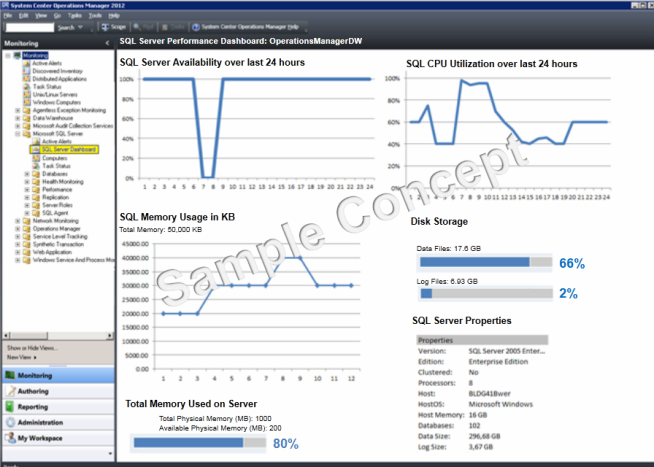
There will be a top-n widget. Will be very useful in many views.
In a concept picture for a SQL dashboard there was a sample of this. Actually I will post screens of these samples right here. Keep in mind these are just samples and not the real thing yet. Things could look a lot different after these are actually created. Nice to see work is being done in that area.
Next was a demo of a Network summary dashboard. This shows the devices with highest load on top, so it can sort and the ones that need the most attention float to the top of the lists.
The vicinity view is shown for the network node dashboard. Vicinity view is able to also show computers connected to the network devices. This is a long requested view.
The average availability for last day/week/month is shown for a device and some performance graphs. Graphically there is a lot more to see now which is good.
Ake shows the SCOM Management Group Health dashboard, pointing to Resource Pools, SCOM Infrastructure and some active alerts that relate to SCOM itself, Agent configuration and agent versions. Here is another picture to illustrate part of that view:
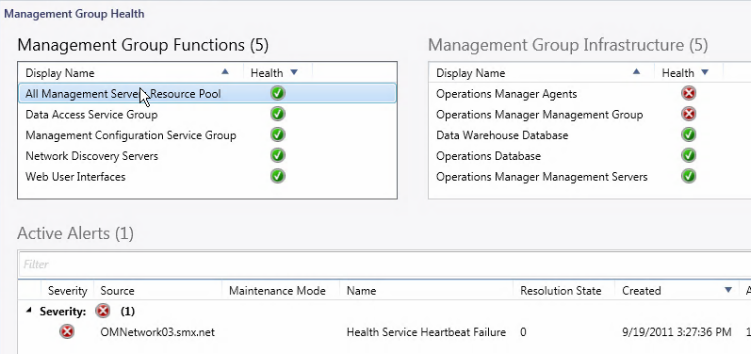
There will be things added and changed on this dashboard as well in the coming weeks.
Management group health trend dashboard. Shows trends in for instance active alerts over time and agent health states over time. Good to see alert storms during the past few hours or days and also to see how many grey agents you are having at the moment and keep track of those trends.
Some points from the questions session:
- For the SharePoint web parts, read through the documentation very well when installing.
- It is verified that the SLA dashboard does not have the former limitation of 6 objects per SLA and/or SLO.
The next meeting will be on 4 October, same time same place. This one will be about Application Monitoring (so Avicode integration in SCOM 2012). Looking forward to it!
Bob Cornelissen