This is a continuation of the SCOM Reporting blog post series. Today I want to talk a little bit about Availability and/or SLA/SLO reporting.
Basically stakeholders for the monitoring often want to know if a server or application was UP during the last month/week/day. In SCOM this is defined by two items, the agent itself being available (Agent heartbeats through the watcher), and the Health state of whatever it is you are looking at. We must make a choice here on what we call down.
Most often a red state is considered critical and a down state. This is not always the case in the real world of course. But we have to make a choice on what we define as down. A server itself has an agent and we could say the server is down when the agent is down. Of course the server itself could be running fine and the SCOM agent may have a problem. But we need to make a choice on what we can go on. It is also why we have alerts and dashboards telling us when a server is unavailable, and when some object monitored by SCOM goed into a red state. So you can react to it.
Availability Reporting
In the Microsoft Generic Reports Library you will find the Availability Report template.

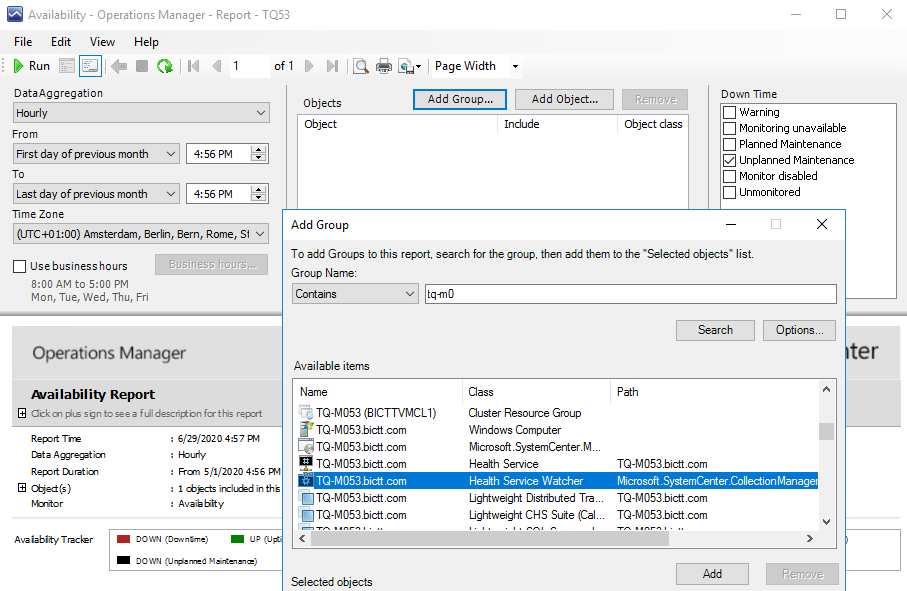
If we open up the report we can make the choices of time range again. In this case I just selected the Previous Month entries.
Next we define what objects to report on. I left that popup screen open in the picture above. I used the Add Group method, because it covers also underlying objects.
I took as example the SCOM server itself here, which is not what we are normally interested in (if SCOM is down, the data will not get into the report very well). But as example I selected the Health Service Watcher class object of this server. This is basically the thing which tells you if the SCOM infra has gotten heartbeats from that agent. For SCOM this is an indication if the server is up up or not.
You can also select other objects living on these servers. For example a database or a website. The whole server being available is not that interesting because you are interested in what the machine is actually doing!
To the right of the report wizard is also a list of health states you can consider to be Down Time. So Critical is by default, and all the other choices can be added, even Warning state. Be careful again, because you may report things as down, while they were still effectively running. Always understand your choices, because you WILL have to explain them to the stakeholders looking at these reports!
SLA/SLO Reporting
Now there are cases where you have implemented more monitoring, such as a Distributed Application. This could be an application with a front-end and a back-end and maybe also made high available across several servers. In some cases these can be as simple as adding a single Website object, but can also be much more complex. You can run similar reports on these, but you can also run SLA / SLO reports! This is where you define a threshold for the amount of availability for a Distributed Application or a Synthetic Check like a website.
Before you can run an SLO report you must define an SLO first. By default there are none defined in any default management pack.
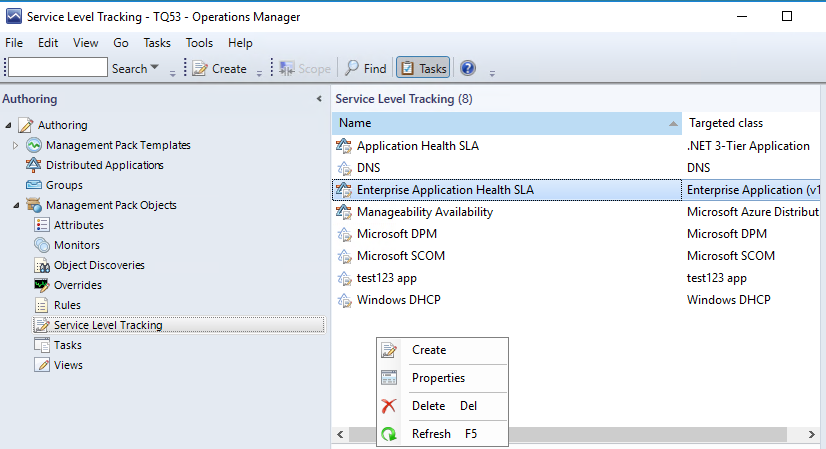
Go to the Authoring pane of the SCOM console and go to Management Pack Objects – Service Level Tracking.

Here you can create a new Service Level Tracking SLO.
You can select a Distributed App or a Website check for example as a target, and you need to specify a percentage where you feel the SLO will be broken. This could be at 90% or 95% or whatever your needs are. Save this in a management pack and wait for it to gather some data.
Once you have defined the SLO target, you can create either a dashboard for displaying the SLA values or you can use reporting to show you the SLA values.

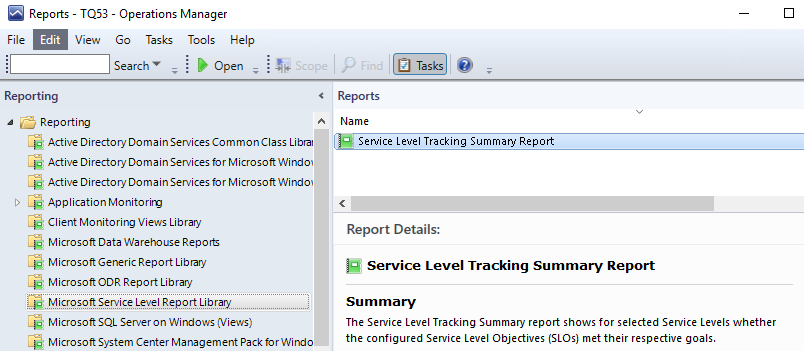
In the SCOM Reporting pane you can find the Microsoft Service Level Report Library and in it the report Service Level Tracking Summary Report.
For this report, you can specify the time range (Previous Month or Previous Quarter is the standard range for this type of report, but for testing purposes, it is recommended to use Yesterday to Today) and the SLO target you are looking for. The last thing to define is which time periods you want to report on in comparison to the initially specified report duration. You could select Previous Week, Previous Month, or Previous Quarter and show them side by side for each of the SLO targets you specified. If you run this report it will show you a few columns with the SLO numbers for each selected time period and for each object you selected to run the report against.
Additional SLA Reporting
I discussed this a few years ago, but if you happen to run Martello Live Maps (used to be Savision Live Maps), you will have Service definitions. A Service is the same as a distributed application in this case. If you create a service from within Live Maps this will automatically create Service Level targets for each of the Service sub structures (User, Application, Infrastructure) and assign a default threshold to it. It automatically starts monitoring and displaying it in the dashboarding and you can change the threshold settings etc from within. Also you can turn on when you want to be alerted of an SLA breach. If you happen to have this product this could make defining the service levels easier.
However even if you do not have this product, there is still a very nice report they have created for you.
The SCOM SLA Reporting Management Pack is a free pack which can be downloaded at: https://martellotech.com/downloads/free-scom-management-packs/
This management pack can run against any SLA/SLO target you have. So if it is SCOM or LiveMaps related you can target it and run the report.
It will also give you a drill-down possibility pointing to the objects within that SLO with the most problems, so you can find the cause more easily.
Feel free to go get it and add it to your arsenal of SCOM Reports.
Back to the master list: SCOM Reporting series – Home and What is SCOM Reporting


1 thought on “SCOM Reporting series – Useful reports Availability and SLA”
Comments are closed.