
This is part 4 of the series on how to monitor services with SCOM. Will be a lot longer than the other ones.
First again the list of posts in the series (as far as I know until know):
- SCOM – Monitoring a Service – Part 1 intro
- SCOM – Monitoring a Service – Part 2 basic service monitor
- SCOM – Monitoring a Service – Part 3 service monitor template
- SCOM – Monitoring a Service – Part 4 basic app mp
- SCOM – Monitoring a Service – Part 5 unix/linux service
- SCOM – Monitoring a Service – Part 6 Other options
I this part we will move towards creating a custom management pack with first a discovery of the application. Based on this discovery we can target monitors to monitor services and other stuff this application depends on. We will also place these monitors in a rollup monitor in order to group services in the Health Explorer. From here we can move forward to views. This part is more complicated and contains more steps. There are multiple ways to accomplish this and this is just an example and you might want to change things or targets or leave things out. But this will still be done completely using the standard SCOM console.
So I am going to take the Microsoft FCS again as an example and I am going to create an attribute that is based on Windows Computer. Again, more ways are possible. I am sure that by the end of this you will know where to make the changes you need. So lets take the steps to build something.
First we create an attribute and registry discovery in a new management pack. The management pack will be called “Microsoft FCS”. We do this in order to find machines that have this application installed and we will enable monitoring of this application for those machines. Here we go:
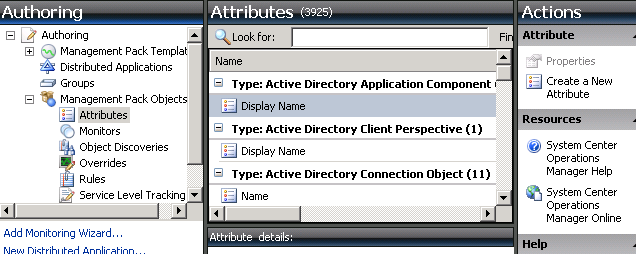
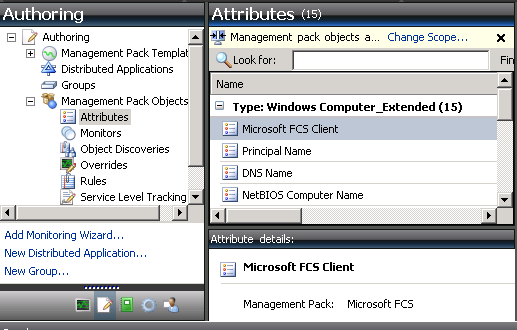
Open up the SCOM console and go to the Authoring pane. Go to Management Pack Objects – Attributes. Click Create a new attribute.
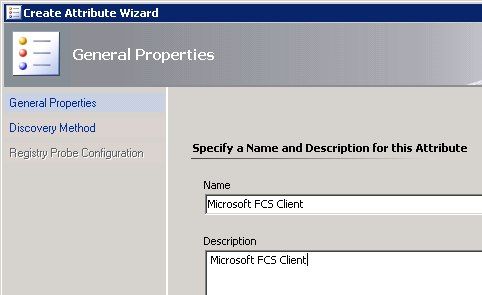
We need to specify a name. I will use the application name to identify it “Microsoft FCS Client” and click Next.
Now we decide on how to discover it. We can use registry or wmi discovery. I will take registry discovery. Now we will fill in the other fields.
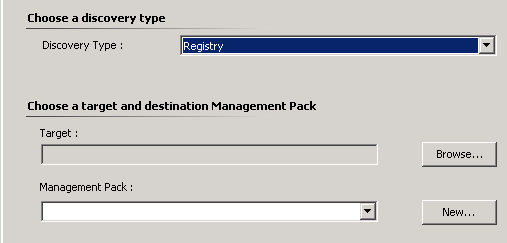
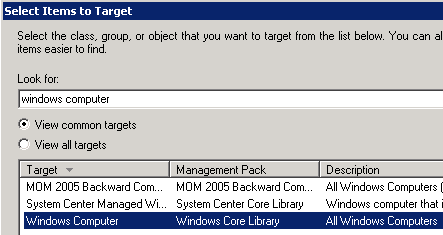
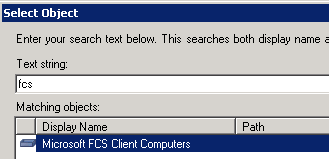
As with everything in SCOM we need to target somewhere. SO click the browse button next to the Target field. I will use Windows Computer in this example, so I find it and select it.
When you arrive back at the wizard it now looks like this:
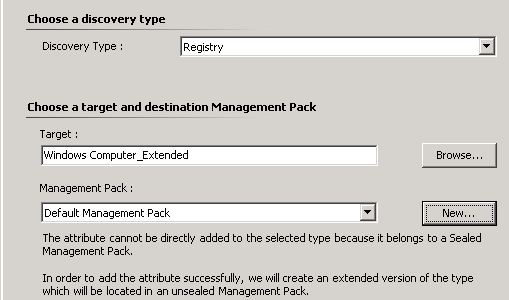
So, here you can see it actually used the Windows Computer, but it placed the part _extended behind it. This is because the Windows Computer is in a sealed MP. You can play around with this name, but I will keep it this way for this specific excersize. So you can change the name at this point and have it reflect your aplication a bit better. Just for this post I will keep it as such, just remember to remember what was here. Just for the rest of this excercise remember that it is Windows Computer_Extended as we will see it often. You will see that it just picks an unsealed MP in the field below it, but as you know we are going to create a new management pack for this application. So click the New button to create a new MP. Give it a descriptive name. I use “Microsoft FCS” in my example.
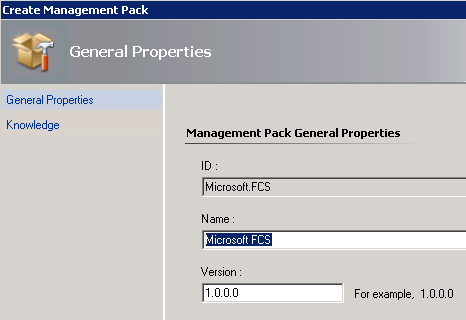
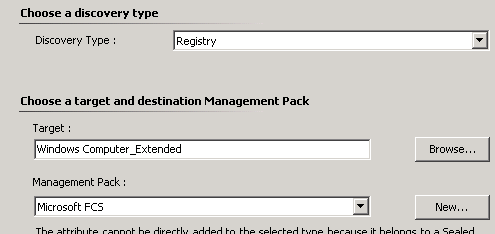
Go ahead and create the management pack. Now we are back in the attribute creation wizard. It now looks like this (and we click Next).
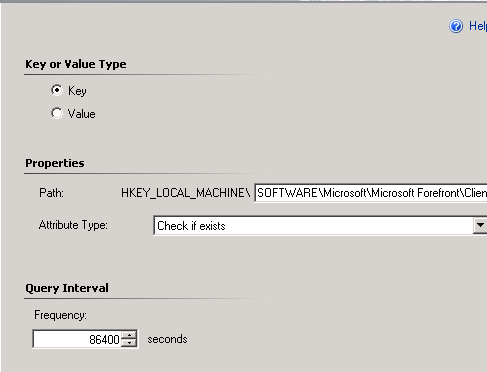
Now we can configure the registry probe. Now in this case we are going to check if a certain registry key exists and use a daily discovery. So first I click the Key type. Next I have to specify the path in the registry to the key I am looking for. Keep in mind that the HKEY_LOCAL_MACHINE is already there. This means we do not have to specify it in the path and that we can not try to find it in the other hyves either :). SO I dive into the registry and in my case I find this entry:
HKEY_LOCAL_MACHINESOFTWAREMicrosoftMicrosoft ForefrontClient Security1.0
It tells us what it is and the version, so we can work with this. Remember to leave out the HKLM at the start. And paste the rest in there. Now we define what we are checking (check if exists). And specify the amount of seconds between each discovery. For one day that is 86400 seconds. It will look like this:
After clicking Finish we will have our attribute. We can check it out in the view we are in right now. Best to use the Scope button on top and find the “Windows Computer_extended” in the list to scope on and you will see it. Go ahead and scope right now as we will need that later.
Alright. On to the next step. We will create a group based on this attribute. We want to get all Windows Computers with this attribute (registry key exists) being true and place them in one group.
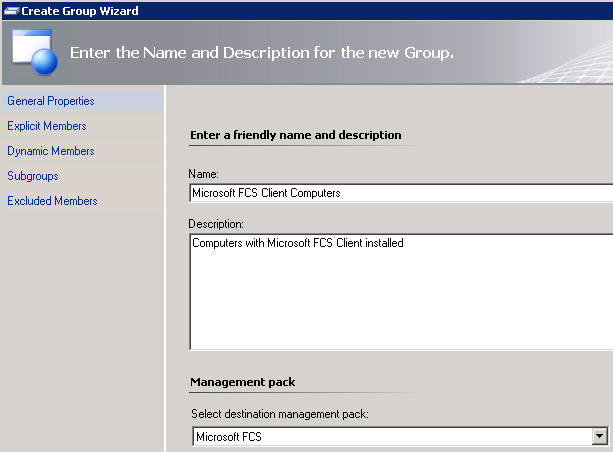
So back in the Authoring pane go to groups and Create a New group. We need to give the group a logical name. I use “Microsoft FCS Client Computers”. Give it a description and place it in the right management pack (never forget there are numerous opportunities to forget that one if we are clicking around too fast!!!).
When continuing through this wizard we do not want to add Explicit members, so we move on to the Dynamic members (so we dont have to worry about it and let the system discover and monitor itself).
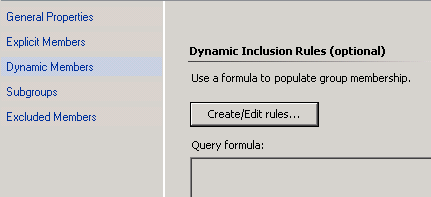
Click the Create/Edt rules at the Dynamic members. Now it asks us to pick a class. Remember that I asked you to remember the Windows COmputer_extended class? First select that one in the first box. Now click the Add button, like so:
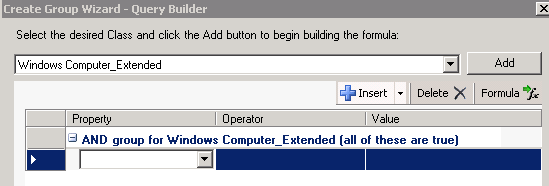
Now we can use the dropdown boxes to define what we are looking for. So in the first box we select “Microsoft FCS Client” (this was the attribute that we were discovering through the registry). Next box we use “equals”. And in the last box we type “true” (in lower case). If you ever wat to do the opposite, like create a group of machines that do not have this app installed you could use the “false” here. Anyway, your view should be something like this:
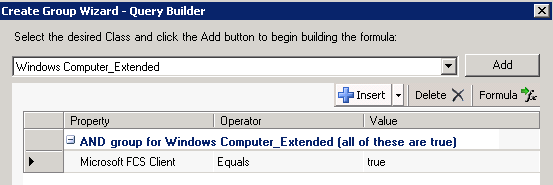
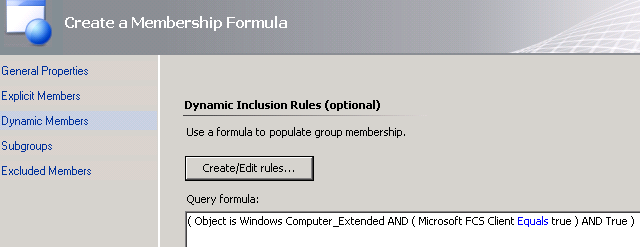
We can click OK now and we are back in the group wizard and we see the query there:
Now click Next and Next and Create to create the group and wait a few small moments for the wizard to finish and the console to load.
Alright, whats next. Because this particular app actually has two services that I want to monitor I would actually like to group them together in the Health Explorer. So I will first create an Aggregate Monitor to hold the service monitoring monitors (what the series was about). Hang on, here we go again.
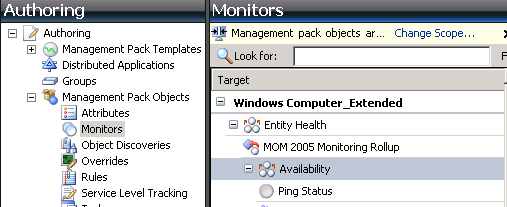
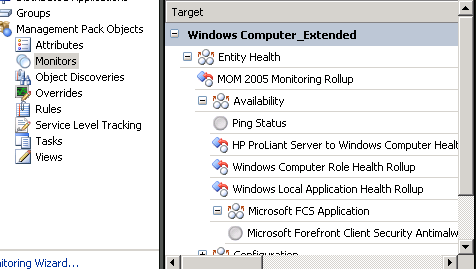
In the Authoring pane we now go to Management Pack Objects – Monitors. Check that you are still scoped to Windows Computer_Extended. Now in the middel of the screen open up the Windows Computer_Extended -> Entity Health -> Availability like so:
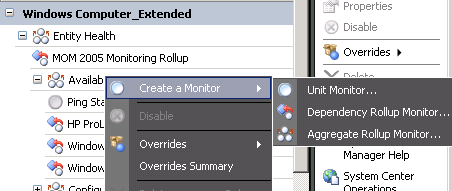
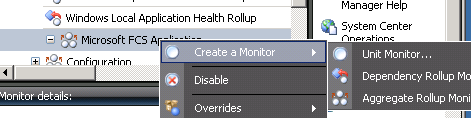
Alright, now right-click on the Availability and select Create a Monitor -> Aggregate Rollup Monitor:
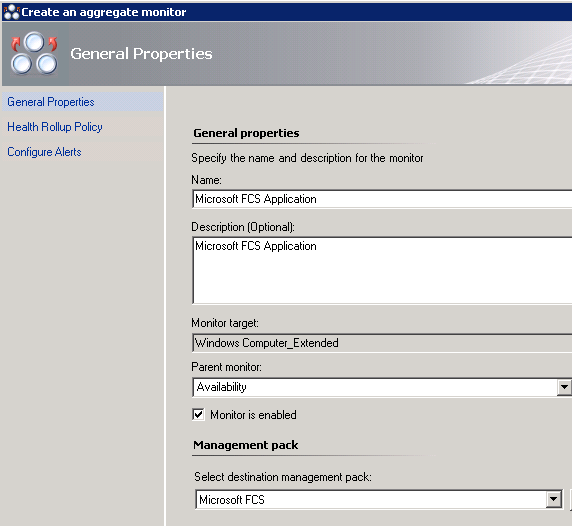
Now we land in the aggregate monitor wizard. We have to specify a name. I use “Microsoft FCS Application”. And type a desciption if you like. Now the Monitor target. If you just followed my instructions on scoping and clicking you will see that Windows Computer_Extended is already selected and below that the Parent monitor is already Availability. This monitor is enabled by default which is good. Please select the right management pack that we have been working on! Your screen will look like this:
In the next screen we will keep the selection of Worst state of any member. Check the best way in your case for this one of course. In my case I just want it to roll up the state if any of the services turn red. And in the following screen we will keep the alerting disabled. To give you an example, you might want to turn on alerting at this level for instance if you have an application that has all kinds of services interlinked and if one is going down the others will follow. That would either create a lot of alerts from all the service monitors, or you could turn all of those off and turn it on at this aggregate level, having the alert say that the application Microsoft FCS has a problem and please investigate further. In this case you would get one alert and you already know what to do and you can check in the health explorer what has happened with the monitors at one level deeper. Moving on… We can click the Create button now.
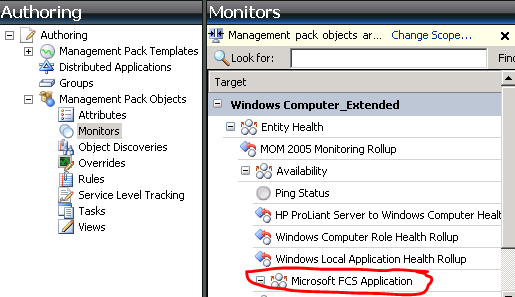
Please check again that it lives at the right level (so below Availability in this case). Now we are ready to get into monitoring the services (that was what this story was about in the first place). So we can right-click our new aggregate monitor and Create a Monitor -> Unit Monitor (now we are getting into the method I used in Part 2 of this series remember?).
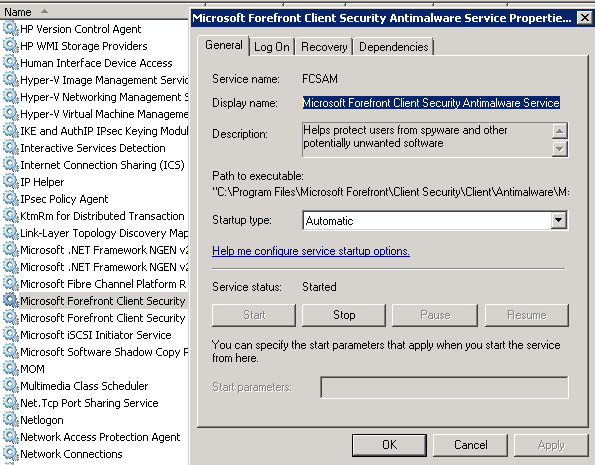
So now we find the Windows Services -> Basic Service Monitor. And do not forget to select the right management pack!! (I repeat myself, because I can tell you that I have made this mistake almost as often as doing it right, especially when you want to move fast…). Now we need to give our Unit Monitor a name. What I like to do is go into the Services.msc console and open the properties of that service. In there you can easily copy and paste the display name of the service. you cant change it but you can copy it 🙂
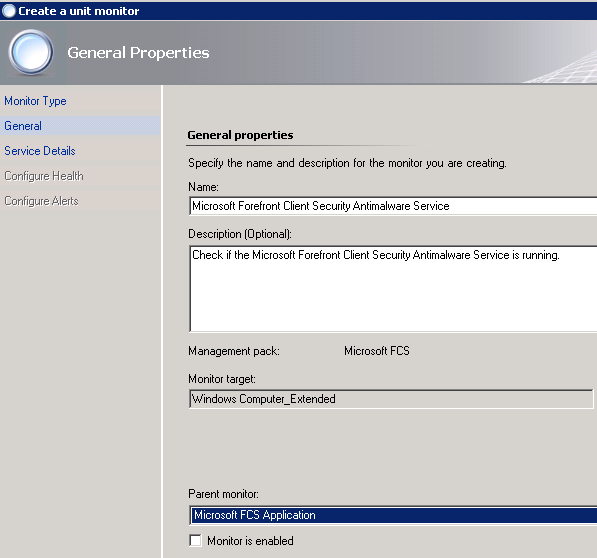
Pay close attention in this next screen, there is a lot to check, so do not click too fast! So we paste that name into the Name field in the Unit monitor wizard. We type a nice description what this monitor does. We check that it is pointing to the right MP. We check that the monitor target is Windows Computer_Extended. Now pay close attention to the partent monitor. Open the dropdown box and find the aggregate monitor you just created before this under the availability node and select it. Next thing is do de-select the Monitor is enabled box. So yes, we are creating a disabled monitor. We will override it later for the group of machines we created earlier that contains all machines that have the application installed. SO your screen will look like this (at least mine does):
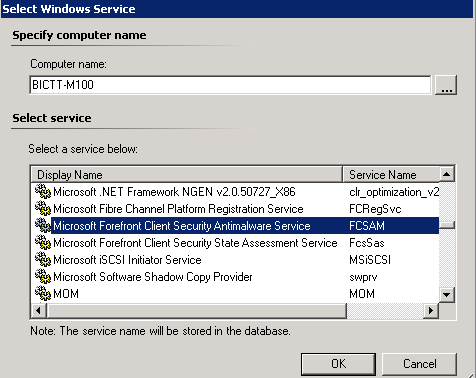
Moving on to the next screen we will have to select a service. SO click the button with the three dots. Type a computer name in the first field and hit Enter to load the services list of that machine. Now find the service we want to monitor.
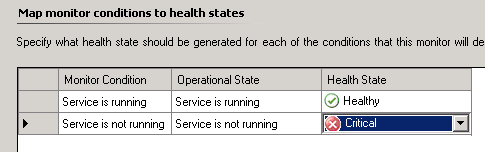
Hit OK and move on to the next screen. So how bad is it when this service stops running. Well I would like the Antimalware service to be the critical one when it stops and after this I will create another Service monitor for the State Assessment service that I will give a warning (yellow) state to when it stops working (to spice up the excercise ha ha ha).
Alright, on to the next screen where we define if we want to alert. Yes we will want alerts for this one, so we use the first checkbox to enable alerting. We will alert if this monitor is in a critical state (which it will be if the service stops as defined in the previous screen). We would like this to auto resolve if the service comes back online. For alert name I will use what is already there and I will add “is not running” to it. Please enter a nice description. You can use the small button with the small dots to create something really nice. This is a bit outside the purpose of this post, so I will move on with this one, I am sure you can figure this one out. Set the Priority… Well Medium is fine for now and Severity Critical is nice for now as well. You end up looking at something like this:
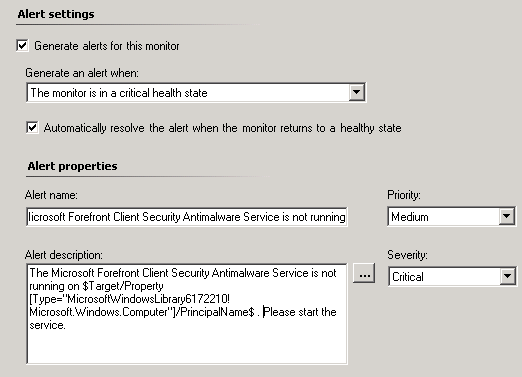
The bits in the description are just formed by selecting the Principle Name in this case, but you can take whatever you want that accomplishes your goal. NetBios name will suffice in most environments as well, but in bigger ones you would want the FQDN name. Now click the Create button.
Here we go, we have a disabled (grey) monitor in the right place.
Now I will create another service monitor for the MS FCS State Assessment service. I will move through this one faster, because you know the drill. I will make this one yellow Warning in health state and also alert on Warning state. Go to the aggregate monitor again (actually select it first) and right-click it and Create a Monitor -> Unit monitor. It is a Windows Services -> Basic Service Monitor. Select the right MP! Give it a name (paste the name of the service) and give it a description. Make sure monitor target is Windows Computer_Extended. Parent monitor is Microsoft FCS Application. We DISABLE the monitor. We select the right service by selecting a machine that runs this service and selecting it. In this case I map the health state of Service is not running to Warning. I will generate an alert (so enable it) when the monitor is in a warning health state (check this is the right one with the previous screen in this wizard). Adjust alert name and description. I will give this one a Medium Priority and a Warning Severity.
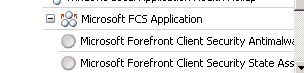
So now we have to service monitors.
Next step is to check if attribute discovery is actually working and has found the application installed anywhere.
In the SCOM console go to the Monitoring pane. Near the very top of the tree on the left side go to Discovered Inventory. On the right side in the Actions pane click the Change Target Type button. Find the Windows Computer_Extended again. Now check if you see the following:
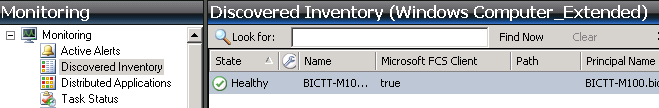
In this case you will see a machine that has done the check and found the Microsoft FCS Client to be true. Other machines that do not have it installed will display false in that column. Remember that the discovery runs once every day, so for some machines it will take a while to appear over here. If you are in a hurry just go to that machine and restart the System Center Management service to have it re-run the discoveries and you will see it within a few minutes. As you know these discoveries will fill the group we created earlier.
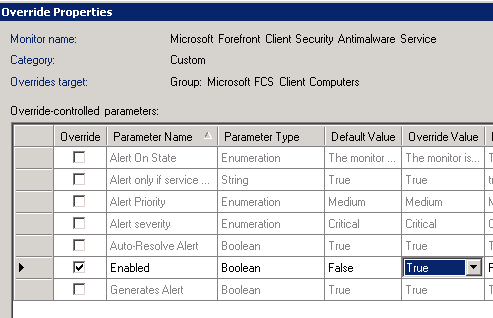
Now we will enable monitoring by going back to those monitors and enabling them for the group we have created. Here we go. Go to the Authoring pane and find the monitors again. If you just came from there the scope should still be there are you will find them in a second. Select the first service monitor. Right click it and select Overrides – Override the monitor – for a group. We will select the group we created. In my case Microsoft FCS Client Computers.
We will now enable this monitor for this group. Set Enabled to True.
Click OK and now make the same override for the other service (in my case). Now get something to drink again and after returning open a health explorer on a machine where the application was discovered:
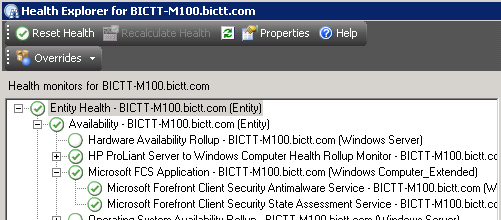
There they are. And the results when we stop the services:
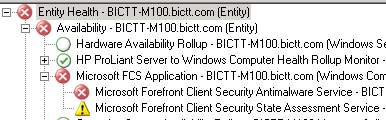
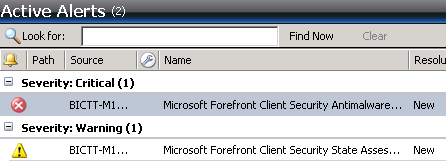
So one red and one yellow. We start the services again and everything turns green again in health state and alerts go away.
From here you can do more fun stuff like creating state and alert views in the monitoring pane. Perhaps a task to Start the service targetted at this class, so when you click the alert you get a task on the right side of the screen to start the service right from there. Perhaps you want to create availability reports. Perhaps you want to add Rules to check the event viewer for certain entries that are related to this application. All things that are out of scope for this post. There are lots of resources on how to do those kind of things as well.
I think this is the place to stop now for this session. But you have seen how you can still build up monitoring an application from the SCOM console, without going to the Authoring console or XML yet. There are multiple roads that lead to the same result and sometimes a better one 🙂
The next post in the series is Part 5 and will be about monitoring a Unix/Linux service. I will use the monitoring template again for this one and use just a few screen shots to get things done due to the great work of the product team.
Enjoy monitoring!!!
Bob Cornelissen