This is part 5 of the series about monitoring a service in SCOM. This is about monitoring a Unix or Linux service.
First the list of other posts in this series:
- SCOM – Monitoring a Service – Part 1 intro
- SCOM – Monitoring a Service – Part 2 basic service monitor
- SCOM – Monitoring a Service – Part 3 service monitor template
- SCOM – Monitoring a Service – Part 4 basic app mp
- SCOM – Monitoring a Service – Part 5 unix/linux service
- SCOM – Monitoring a Service – Part 6 Other options
In the previous posts I went into monitoring windows services in several ways. In this post I will go into basic monitoring of a Unix or Linux service. This will be done based on a monitoring template just like Part 3 of this series, but this time for Unix/Linux services of course. Again several methods are available, but this is the easiest one to get a quick start. In most cases I encountered the question was just to pick up the running state of the antivirus agent, the backup agent and one or two services running state. In this case I will just use the cron service (Alright, I know it is already monitored by default by the cross plat mp’s, but just needed an example).
Also this post assumes some small things, like being able to create a new management pack to store stuff and to select something by clicking buttons with three dots on it. Otherwise have a quick look at parts 2 or 3 in this series.
So lets get going with this one.
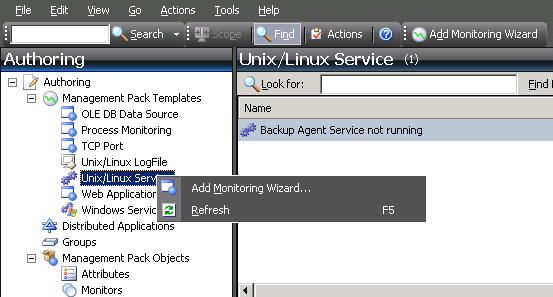
Open the SCOM console and go into the Authoring pane. Expand Management Pack Templates and select Unix/Linux Service. Right-Click and select Add Monitoring Wizard (or click the button on the menu bar).

Select Unix/Linux Service and click Next.
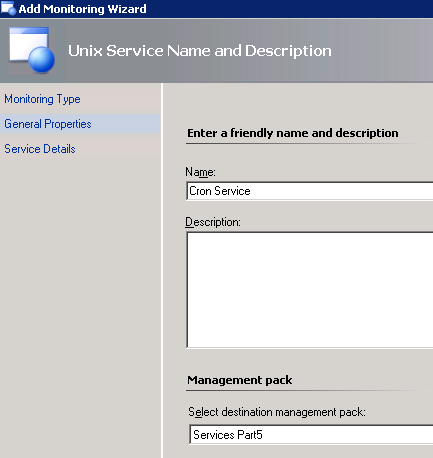
Give it a name, for instance “Cron Service”.
Create a new destination management pack (click the New button and give the MP a name and click Next and Create). Always create a new management pack for this or select a specific one that suits this purpose (just not the default management pack).

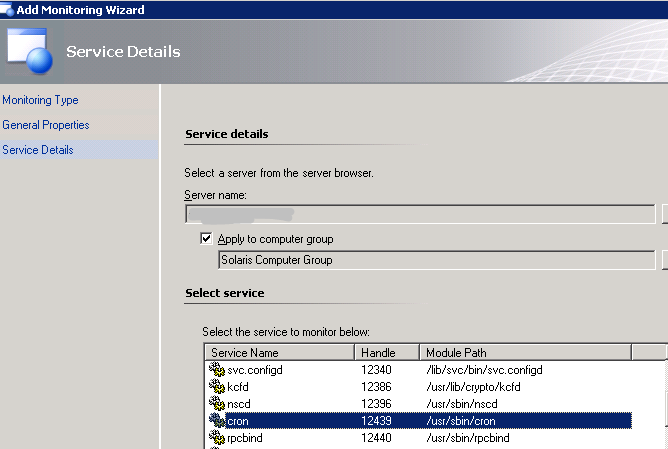
In the service details part we will first select a server that has this service running by using the button with three dots. Next we will want to select if we want to select a specific group to target this to. For instance custom groups you have created or perhaps you have some service running specifically on Sun servers or RedHat servers. So for fun I will select to apply it to a computer group. So I click the checkbox and in the group search field I type solaris and click Search button and select the Solaris Computer Group. So if all your Unix boxes have the same backup agent or whatever you can target this monitoring wizard against those kind of groups and the server you select here is just an example of it. Next we select the cron service that we wanted to monitor in this example.

Click the Create button and it should be there in your list and monitoring is going. Just wait a few minutes to have it initialise.
As you see the cross plat team within the SCOM team has done a great job at using the template and getting it to monitor processes with just a few clicks!
Now lets move on to some resources and links and stuff in the last part of this series to wrap things up.
Bob Cornelissen
