
This is part 2 of the multiple part series on monitoring a service (yeah how much can we say about this…?).
To start the links to other parts of the series:
- SCOM – Monitoring a Service – Part 1 intro
- SCOM – Monitoring a Service – Part 2 basic service monitor
- SCOM – Monitoring a Service – Part 3 service monitor template
- SCOM – Monitoring a Service – Part 4 basic app mp
- SCOM – Monitoring a Service – Part 5 unix/linux service
- SCOM – Monitoring a Service – Part 6 Other options
And now on to monitor a windows service the very very basic way. We will create a new management pack to hold the service monitor and we will add a basic windows service unit monitor that creates an alert when the monitored service is not running. This is very basic and will do no more or less than stated 🙂 I will screenshot a bit often here in parts 2 and 3 of this blog post and will assume some things in other parts.
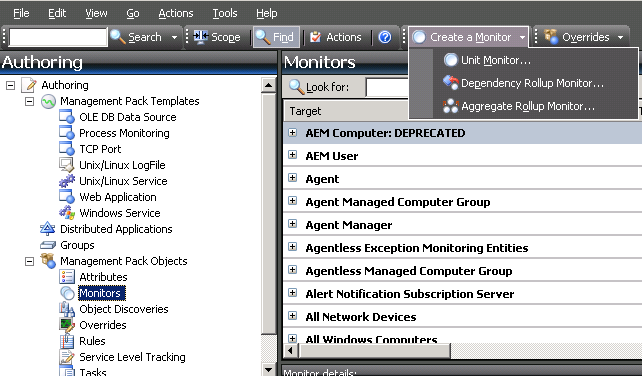
Go into the SCOM Console and move into the Authoring pane.
Expand Management Pack Objects and select Monitors.
In the menu bar or in the Actions pane select Create a Monitor -> Unit Monitor.
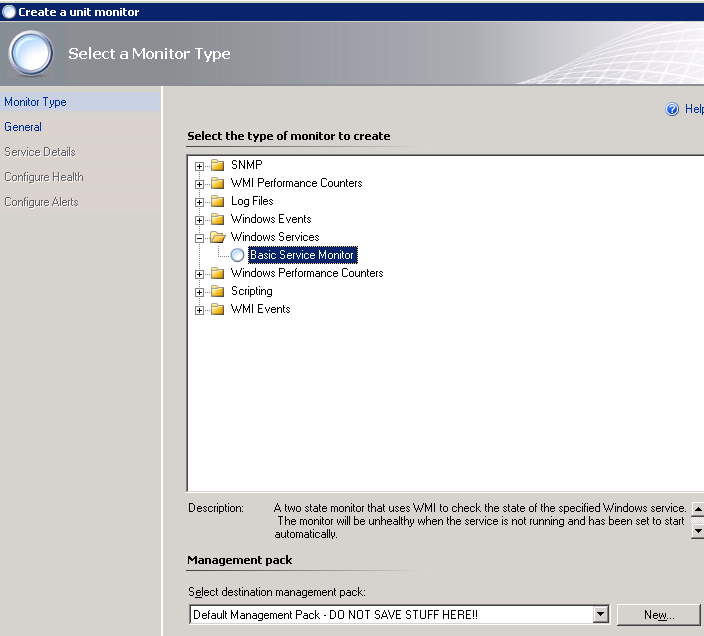
The Create a unit monitor wizard opens up. Before we do anything else we need to have a management pack to save stuff in. We could have done this before, but in this case I will use the first monitor we create as an opportunity to create a new management pack. So near the bottom of this screen click the New button.
When the Create a Management Pack wizard opens we add a Name for the management pack. In this case I use “Services Part2”, but normally this would say something about the application you would want to monitor or the purpose of it. We can add a description here.
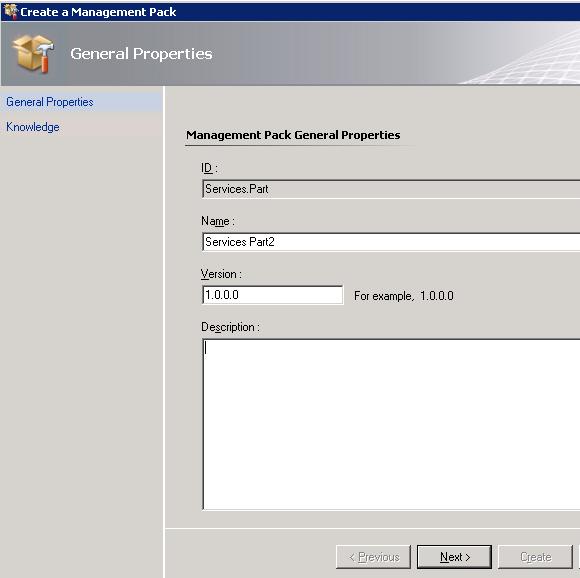
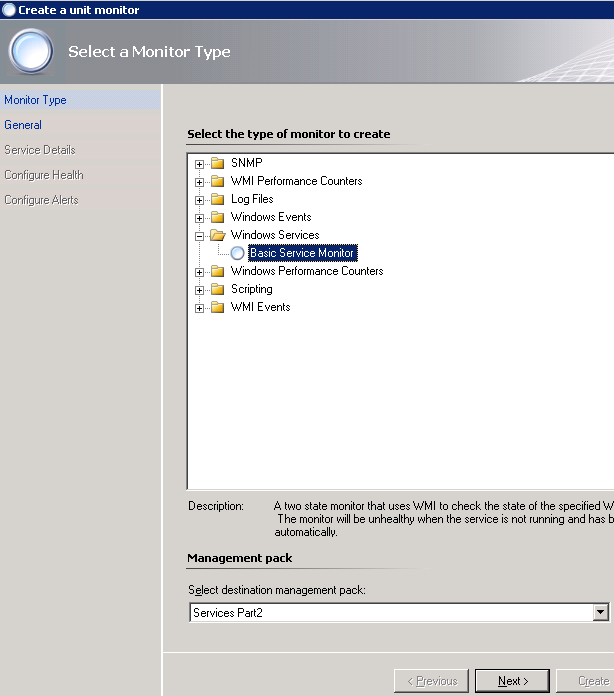
We finish this part of the wizard by clicking Next and Create. This will bring us back to the Create a unit monitor wizard and the newly created management pack will be listed as the destination management pack near the bottom of the screen. Next we define what kind of monitor we want near the top of the screen. In our case this is Windows Services -> Basic Service Monitor. Click Next to continue.
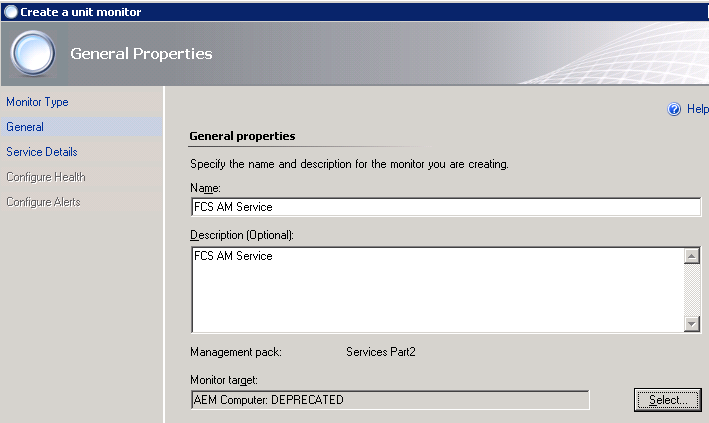
In the general properties we will define a name for the monitor. In this case I will just use “FCS AM Service” as Name and Description to keep it simple.
Now we need to specify a Monitor target. So click the Select button in the middle of the screen.
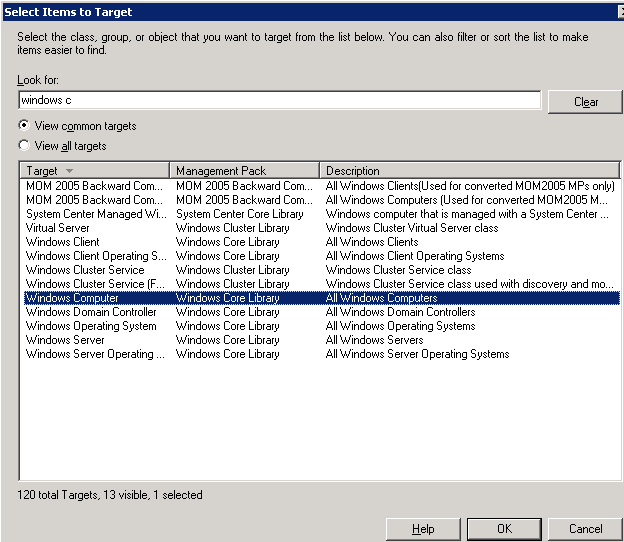
We see a big list of targets (and we see even more when we select the View all targets option). We need to think of where we could possibly target this. Well, one of the things we know is that it runs on windows computers. That could give us Windows Computer and Windows Operating System for instance (if we say that we dont want to specify a specific operating system). I will go with Windows Computer for now.
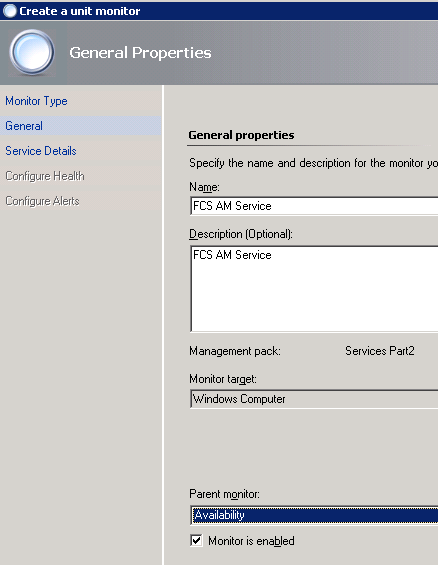
We need to specify the Parent monitor now. As we are monitoring the running state of a service we will use the availability parent monitor. And click Next.
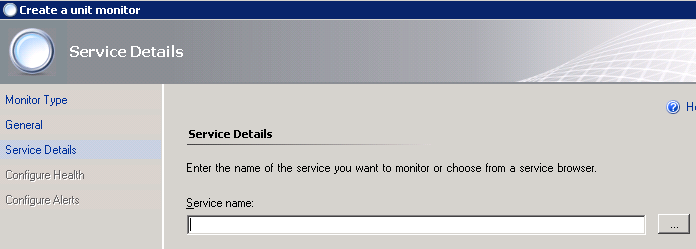
So now it asks us for the Service name. It is easier to browse there, so we use the small button with the three dots.
Pick a machine where you know this service is installed. Find the service you want to monitor in the list and select it. In my case I pick the Microsoft Forefront Client Security Antimalware Service.
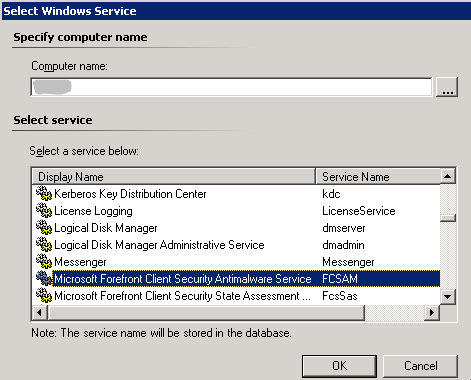
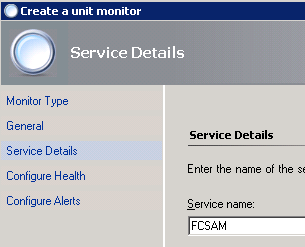
When we click OK it will bring us back to the wizard and it gives us the name of the service (as windows would understand it).
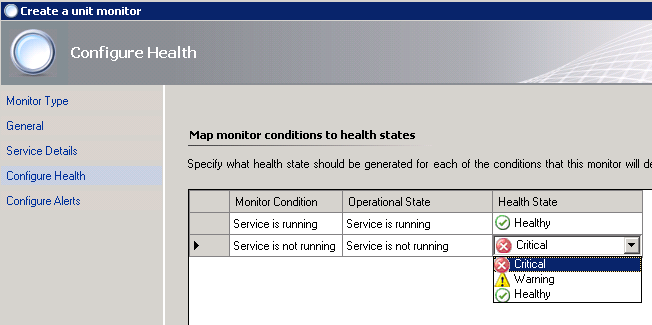
Click Next and we can configure what the health should be if the service is not running. In the box where it says Health State for the row where it says Service is not running we can select what state we want by clicking and using the dropdown that appears to either select Critical or Warning. For this example I just think this is a security service so I will leave it as Critical.
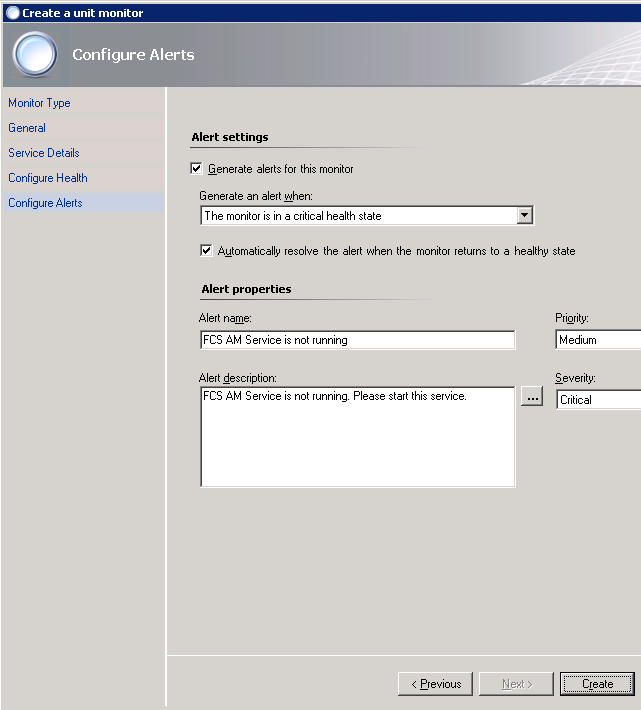
Next step is to define if we want to generate alerts for this monitor. Lets go ahead and do that and check the checkbox. Next we need to define when to generate an alert. In my case I said that the state of service down should be Critical, so my choice is to generate an alert when the monitor is in a critical health state. If you had Warning in the previous screen you will need to use the warning state here as well in order to get alerts.
The checkbox to Automatically resolve the alert when the monitor returns to a healthy state is very usefull in most cases. So if the service returns to running state (either automatically or because you start it manually for instance) it will also close the alert for you in the SCOM console.
In the alert properties we can define an Alert name. BY default it displays the name of the monitor here. In my case I add some words to make it say “FCS AM Service is not running”. I copy that to the Alert description box below it and add some words to it suggesting to start the service. I will not add more fancy stuff here although the small button with three dots will give you possibilities to add the server name in the description for instance. Next we can also set Priority and Severity of the alert. I will leave it default for now. That will give us the following screen.
Now we can push the Create button to create the monitor.
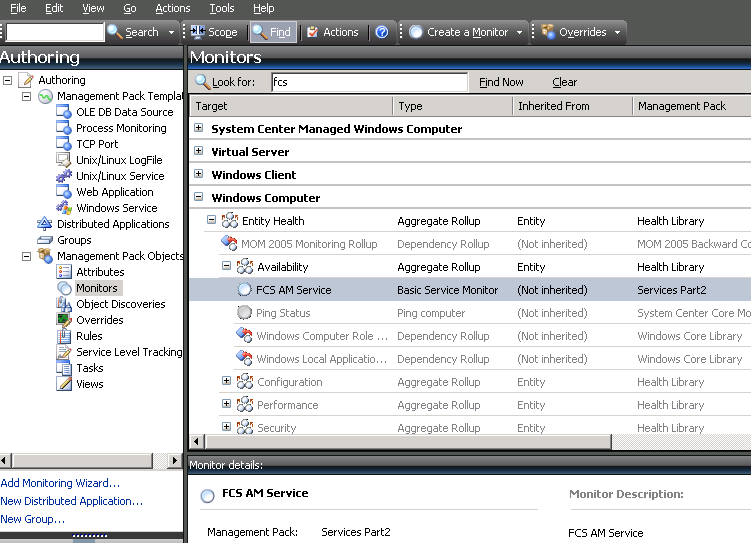
We will have a monitor now for one service in a new management pack with alerting when this service is not running.
New I can pick a machine and stop this service and see if I get an alert in the monitoring pane in Active Alerts.
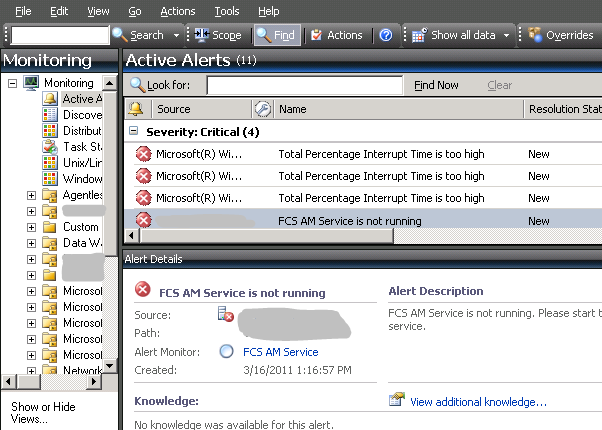
After starting the service the alert disappeared within the minute.
So that is the most basic quick and dirty way to monitor one service.
Now lets see in Part 3 of this series how we can do this using the Windows Service monitoring template and at the same time make a choice if we want to monitor the processor and memory usage of this service (process) and at what threshold it should start complaining.
Bob Cornelissen