
It has been a while since I wrote about Veeam and their management pack for monitoring VMware products (did you know they also added Hyper-V to that now?). Lately I got a chance to install this pack in a reasonable size environment, so this is a good chance to write more about the product and what it can do for us.
Situation sketch
This environment has two VMware infrastructures. One for the servers based on 60+ hosts and one for the VDI desktops environment also roughly based on 60+ hosts. This situation also requires that we have different monitoring for each environment, because we are not really interested in VDI desktops which get destroyed and rebuilt every day. But in the server infra we are interested in the guests as those are the ones we also monitor with SCOM agents. I will discuss as well how this was achieved, because Veeam has a way of doing this which not every organization will use, but it is very useful in the scenario we are dealing with.
Design
When designing your Veeam-SCOM monitoring infrastructure there are a few things to keep in mind which affected our design in this scenario.
- Numbers. A bit of an open door, but the amounts of hosts/datastores/VM’s you monitor has an effect on the sizing of your Veeam Collectors. Deciding whether or not to monitor VM’s makes a big difference.
- Wanting two separate methods of monitoring for the two environments is best done with the use of Monitoring Groups. It is a feature included in the Enterprise Plus license of Veeam and gives possibility to create in our case two Monitoring Groups. Each with their own collection policy (one not interested in collecting VM information for instance).
- A Collector can only be a member of one Monitoring Group.
- High Availability, even though a collector might be able to handle the load it might be desired to have an additional collector in each monitoring group for high availability purposes and during normal situations a way to spread the load.
One good piece of advice is to download the resource kit and use it. It has an excel sheet in it which is a calculator for the estimated number of collectors you need for a certain environment!
By the way you will find that a collector can handle a very nice load. The stability of this platform has been strengthened throughout the years (And I have been stress testing previous versions of the pack for years in some big environments just to see when it would break down under the load and give the feedback to the developers).
In our case we went with 3 collectors for the server VMware environment and for 2 collectors for the VDI environment. Because we were not interested in the VDI VM’s this was enough to also provide high availability for the collectors within the monitoring groups.
Monitoring Groups
Because not many are using the monitoring groups feature I will show you what it looks like.

This picture shows on the left hand side the monitoring groups. The top one is the default and the other two were created manually. The example shows the VDI monitoring group with 2 collectors and some stats. In the middle of the picture there are two important things we adjusted as a start. First of all to change the collection interval from the default 5 minutes to 10 minutes (this basically gives a bit less data flow simply because it collects for instance performance data less frequently). The second important setting is setting the Collect VM Data to false for this monitoring group. With thousands of VDI VMs this makes quite a difference.
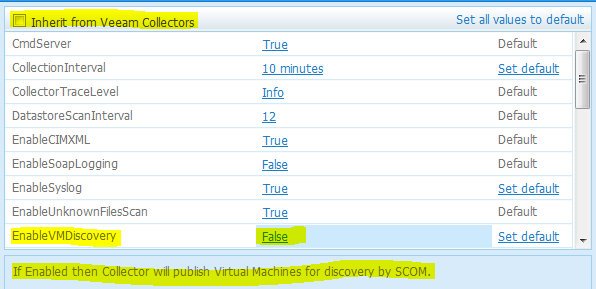
If you open the monitoring group collector settings you see first of all the possibility to stop the inheritance from the settings of the top level to flow down to this monitoring group. Next we set the EnableVMDiscovery option to False to stop the discovery of VMs and their data from going towards SCOM.
Something else to note in these settings is the CollectionInterval which in this case we set to 10 minutes. And as an example the DataStoreScanInterval that is set to a number, which is actually a multiplier for the CollectionInterval. So when I changed the CollectionInterval from 5 minutes to 10 minutes, also other collections which happen less often are dependent on this setting. In this case the Datastores will be scanned every 12×10 minutes, so every 2 hours instead of every 1 hour. Keep in mind that when tinkering with the collector settings there might be multiple things happening in the background. In case you want to play with the default settings make sure you read up on what these settings do. Veeam MP is very well documented from design to install to adjusting to monitoring.
Now, when starting out with the installation and connecting the collectors to the VCenter servers we deliberately set the collection interval to 10 minutes and also the VM discovery to disabled on both monitoring groups. We figured the amount of data coming in from only the hosts, VCenter, clusters, datastores and hardware and so on and the resulting alerts from that would be enough to start with in the first few days. This was a good decision as there was enough to start with all these layers without already putting the VMs layer on top of it. For larger environments I think it is useful to phase in the deployment this way to give opportunity to do tuning and tweaking and discuss the resulting alerts and views with the operators. It also gives you opportunity to check on the performance and dataflow of the collectors and their agents and the SCOM infrastructure. Check also for most common alerts and health state changes and the amount of performance data coming in and see if this suits your needs. After that continue to the next phase and bring in more monitored stuff.
Hope this was useful to show a case where monitoring groups within the Veeam Management Pack can be used and why. Actually I wrote this post a while back and did not get to posting it until now. Meanwhile we have done a lot of tuning and dashboarding for instance.
Bob Cornelissen