After creating a web check monitor in SCOM using the Web Application Availability Monitoring template or the one for Web Application Transaction Monitoring you might get errors on the monitored web pages you did not expect. Default error codes like 400/401 and such are relatively normal status codes, but there are more things which may go wrong.
In this case we saw an error code popping up here:
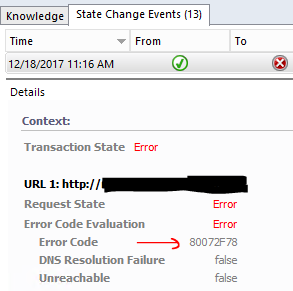
Something which is written in the product knowledge, but may elude you is a story about custom errors like this one and how to find what they mean.
Unfortunately this requires an extra step.
We have this error 80072F78 and it turns out this is a HEX code and on the page where we have to find the error codes it is written as a normal number. I think it is unfortunate, but how to get there anyway?
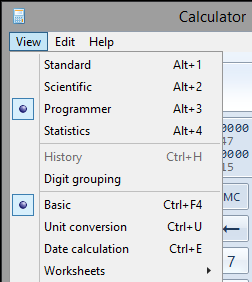
Open up Calculator and set it to Programmer mode.
Next on the left set it to HEX. Fill in the LAST FOUR digits of the error code you had. So in this case 2F78.
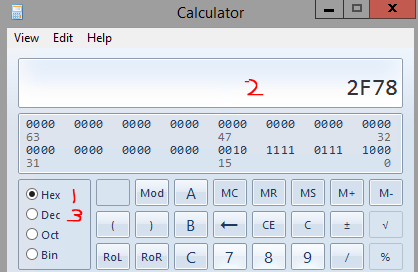
Click on the Dec option in the above picture to get the below result:
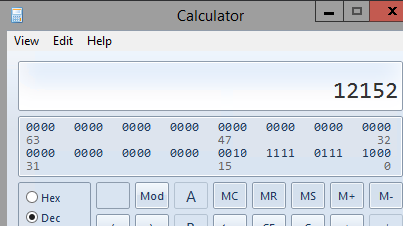
Now we have a code 12152 which we can go find on the following site
https://msdn.microsoft.com/library/aa383770(VS.85).aspx
to get:
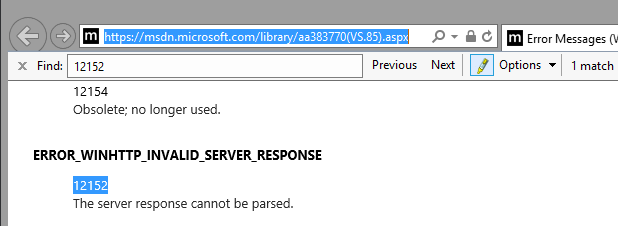
I am not saying these kind of errors are much more clear using this method, but it seems to be what is received by the IE engine in SCOM.
Good luck!
Bob Cornelissen
