I get asked a lot for performance reporting for large groups of servers (with changing memberships). The problem that people face with this is that it usually involves an initial very big list of machines and it takes a lot of time to build this. Also if this report has been published and scheduled they find that they need to make changes to the report due to changes in servers they are reporting on (adding or removing machines). Actually I got this same question four times in one week from three different customers and one friend of mine. Enough reason for a posting.
Now let me start by saying I have not found the ultimate solution yet, but I can tell you what I always do and what several of my customers are now using.
Actually I will also let you know how to make the report for a big list of servers and publish that one in case you have a situation where the group of servers to report on does not change. This just saves you a lot of time in making those reports!
Just to specify a little bit more what most of my customers have been looking for… One or more reports, that contain a few performance counters, and they need it for a long list of machines, and in most cases that long list changes due to adding and removing servers from the network. Could be that they need this for capacity management, compliance, basic reporting to other groups in the organization, because those counters are mentioned in the Service level agreement as being measured etc etc. They do not want to manually change a number of reports after every change just because they add or remove servers from the network, especially for big networks with lots of changes.
So let’s start
I will first tell you the short version of the trick and then show you an example.
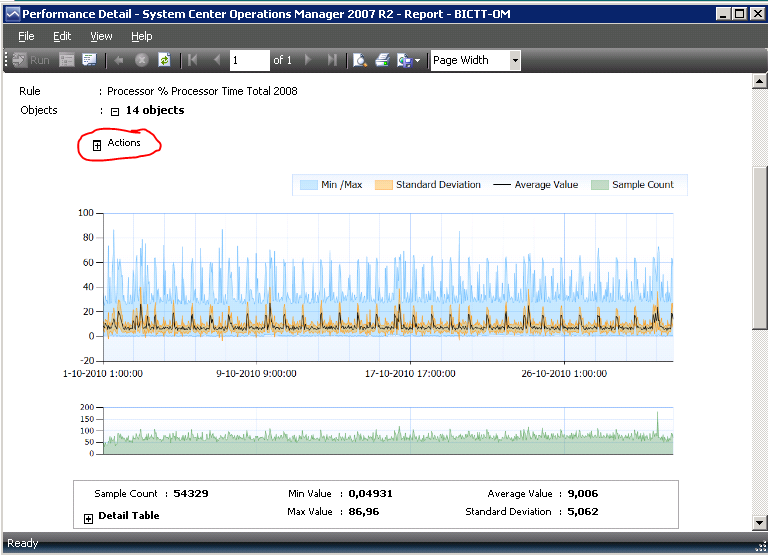
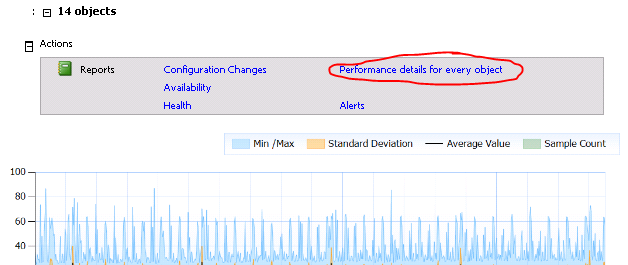
I start by creating a Performance Detail report from the generic reports. I create series in that report. One for each performance counter and I target it at the big group. I add the Windows Computers group or whatever group you know covers all of the servers you want to have in the report (this should be a dynamically filled group so you don’t need to manually change the group every time!). I set the date specifications etc as needed (Last month, Last Quarter). Run the report and publish it. Yes I know you now see all servers bundled in one line in a graph (one graph per performance counter). This is the one I always publish and schedule first. Also the first the customers will check for abnormalities. Above every graph there is an Actions word with a + sign next to it. Open it and go for the option in the right-top corner of the field that folds out. Now you see one graph per server in one report (all for that one performance counter). Now if the group membership will never change you can simply Publish this report and you are done. Do this for every performance counter of course by going back to the parent report and doing the same for another graph. If the group of servers does change (in some environments this happens a lot) you are stuck by just automatically running the parent report at every interval (week, month, quarter) and going into the reporting pane manually to open every graph like mentioned above and saving the resulting report to PDF or Excel for instance. In most cases the interest is for at most 10 counters so this will take you 15 minutes every month to do, which is mostly acceptable. Also because I always create reports for “Previous Month first day to Previous Month last day” it doesn’t matter if you run the reports on the first day of the next month or the 5th day, because last month will stay the same for at least 28 days *grin*
So now for the example in a graphical way.
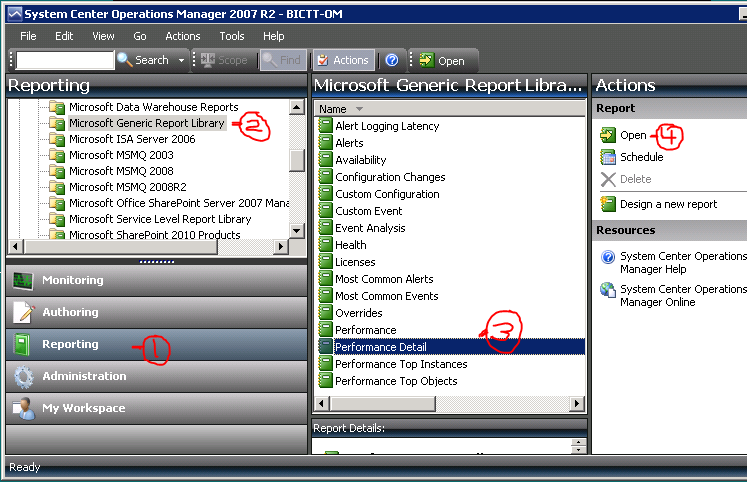
Open the SCOM console
Find the Performance Detail report and open it like so:
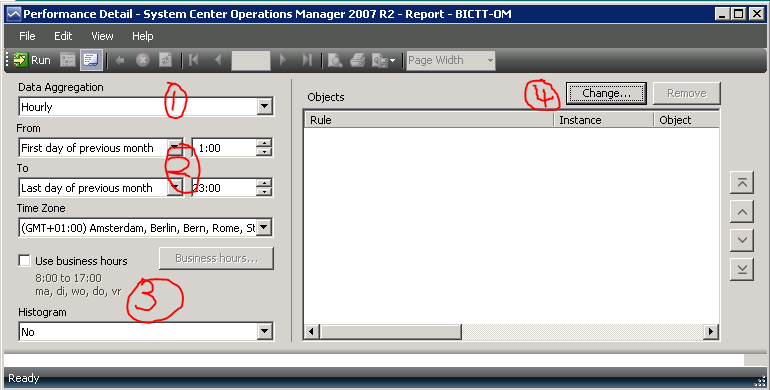
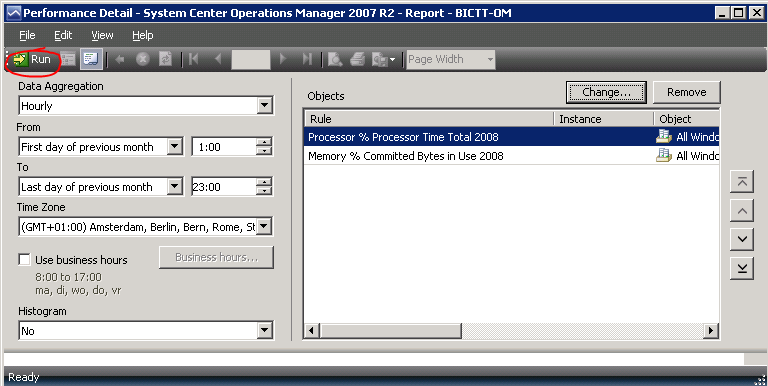
Decide if you want the hourly or daily aggregations. Set the time range (in this case the previous month). Check if you want to use the business hours only or just all. Next step is to go for the Change button in order to add the series and objects.
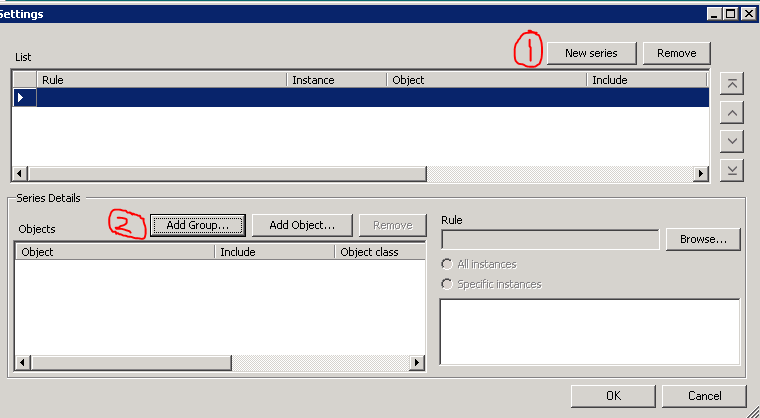
Create a New Series for every performance counter you want to add. Click the Add Group.
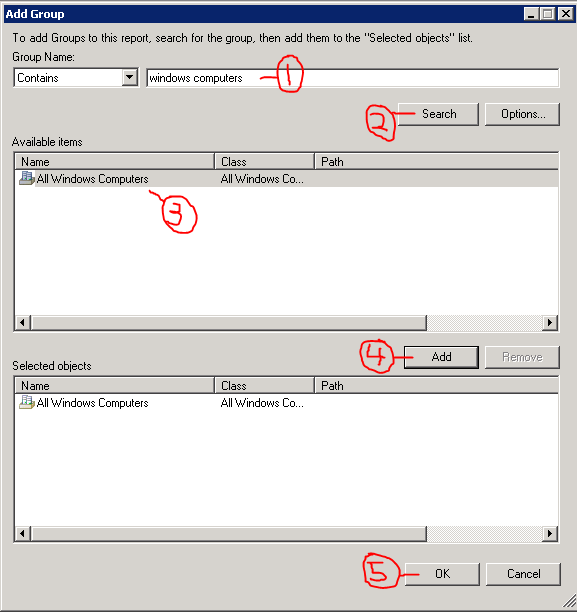
In the search box type the group you are looking for. Either a group included in any of the management groups or one that you have created earlier (all production servers for instance). Click the Search button. Click the entry that you want. Click the Add button to get it in the lower half of the screen. Click OK to return.
The group will be shown in the screen and now we add the performance counter we need by clicking the Browse button.
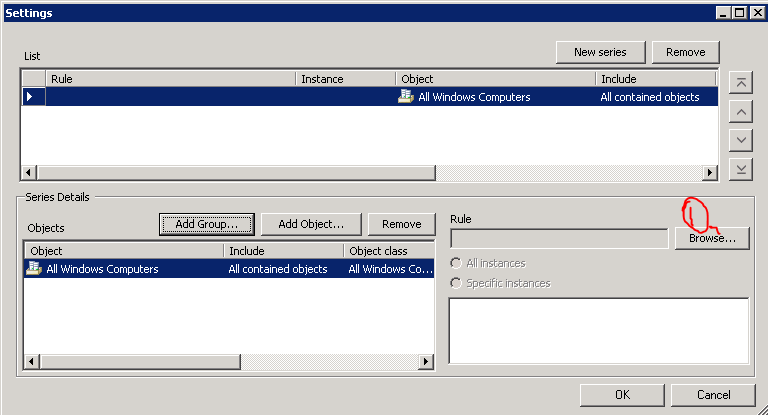
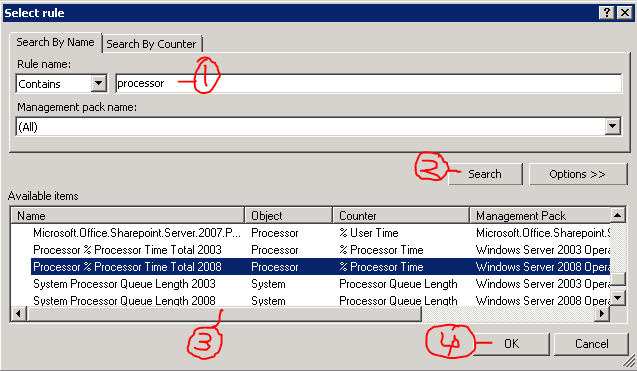
Type what you are looking for. In this case I user processor. Click the search button. It lists counters related to processor (because it has it in the name or the counter). In this case I just let it list everything but you can filter from one single management pack if you know where it is that you are looking for. Find the counter you want (in this case the Windows 2008 processor % total time) and click OK.
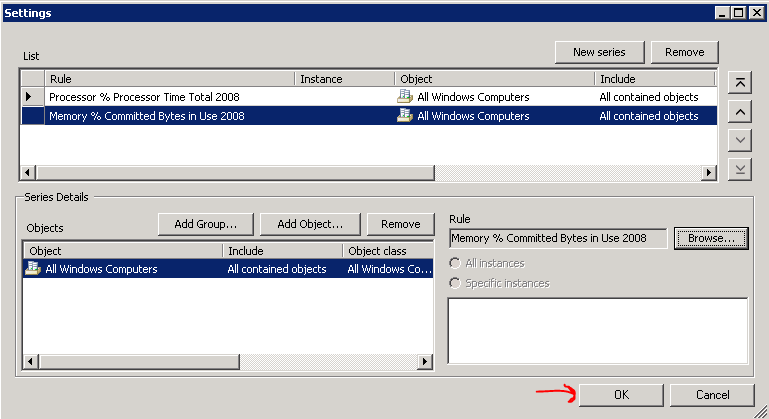
This takes you back to the place where you can either press OK to select this specific counter to work with or you can add more series. An advantage when creating more series is that the last used group is already listed so a simple double click gives you that group. In this case I just add one more counter (a memory counter). Click OK to return to the report screen.
Now we are back into the report screen. All things are ready, so Click the Run button and wait until it finishes.
Now you can publish the resulting report first. This is a monthly performance report for all Windows computers. As you have noticed I have only picked up 2008 based counters here so I only get the lines for Windows 2008 machines in this network. Publishing a report is by clicking the File -> Publish and giving a meaningful name and description. When publishing like this it is only available to you. At this point you can use the http://reportserver/reports and find your own report and move it to a new folder where you want it. I usually create a customer-name folder in the root and move the reports into that one or a subdirectory of it. As it is out of scope to go into this further I will move on to the next step. We now want to have the child report that shows you one line for each machine, but for one performance counter. So on top of each graph there is an Actions word with a plus (+) sign next to it. Click the + sign next to it.
It will open up and give you the options. Use the top-right option (Performance details for every object).
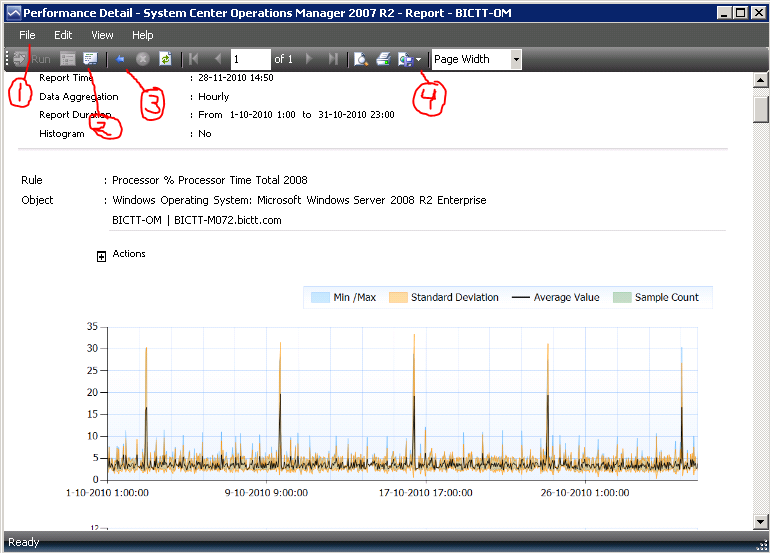
This will open a child report with one graph for each machine in the group you have chosen (…that has measurements for that specific performance counter during the time period you have chosen…). So if the group of machines does not change in the near future you can actually save this report and later schedule it. Or if the group membership does change you can do this manually each month and clicking the export button. So on the picture below you can 1) Publish or 2) check the setting of this report or 3) move back to the parent report or 4) Save the report as a PDF or Excel for instance.
If you use A4 type paper in stead of Letter size paper, don’t forget to add the options mentioned here in order to add the PDF A4 portrait and PDF A4 landscape options to save: https://blog.topqore.com/2009/03/17/sql-reporting-services-render-pdf-in-a4-1
If the group is very big this saves you adding a lot of series and performance counter entries to every single machine. This should save you a lot of clicking. Of course if the group changes every month it doesn’t help publishing this report, because it would require changes every week/month you will have to run it. In this case I always use the parent report and schedule that one and open the child reports (+Actions option above every graph in the parent report) and save those. Usually this is once every month or quarter and is about 15 performance counters in most cases, so this takes a few minutes to run the child reports and save all of them. Something I can live with.
Good luck to all!
Bob Cornelissen

1 thought on “SCOM reports on performance counters for large groups of servers”
Comments are closed.