
This blog post will introduce the new SCOM 2016 feature of Management Pack Tuning. It is meant to use alert data from SCOM to determine where tuning may be beneficial. The screenshots are based on the TP5 release of SCOM 2016 and could be changed in a few months as work continues to be done to several features of SCOM.
The way we often used to tune out alerts and management packs was by a few methods. The first method is to import the management packs and sit back and see the alerts flowing in and taking them on one at a time.
The second method was by using reporting:
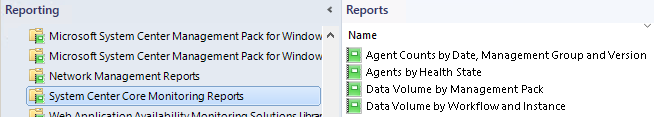
The two Data Volume reports are actually very useful in going through which management packs cause the most data volume (number of performance counter entries collected, number of alerts, number of events….). And they have possibility to drill down into them as well to see which workflows are the busy ones. After this you could go into SCOM and find the rules and monitors and tune them to your liking.
There are also reports in the SCC Health Check Reports library created by Oskar Landman and Pete Zerger which we can use for this. It is called SCOM Health Check Reports V3 now and can be found in the Technet Gallery.
A new solution
Now in order to facilitate alert tuning for you the product team has worked on a custom solution to help you analyze the alerts and which machines cause the most of this and tune the workflows directly from there.
Starting SCOM 2016 TP5 Tech Preview you can now go into the SCOM Administration pane and in the Management Packs folder you will find “Tune Management Packs” now.
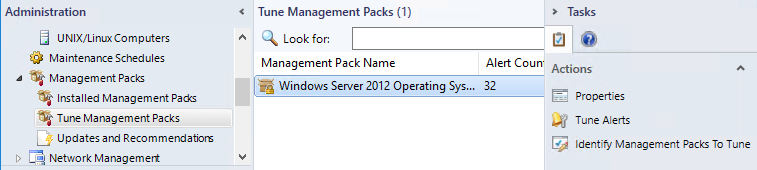
To the right hand side in the tasks pane you will find “Identify management packs to tune” where you can set a time range for analysis. Otherwise just wait 2 days and things will surface.
Now in the middle we see I currently have one management pack which may need tuning and it has given us 32 alerts in a limited amount of time. SO we press the “Tune Alerts” task now!
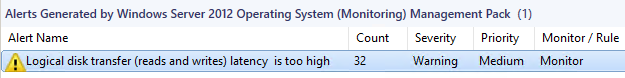
From here we can see which alert(s) came up during this period. To the right of what is in this screenshot there is also the name of the Rule or Monitor which caused this alert.
Now which possibilities do we have from here? If we right-click we get the following options:
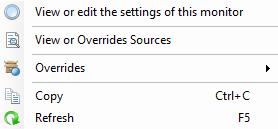
The Copy function will give you the possibility to have a clear text cop of the selected fields so you can put them in a notepad or Excel sheet.
The Overrides option gives you the usual overrides options where you can override the monitor for all objects of this class or a group or single objects.
Of course we can directly open the properties for the monitor right from here.
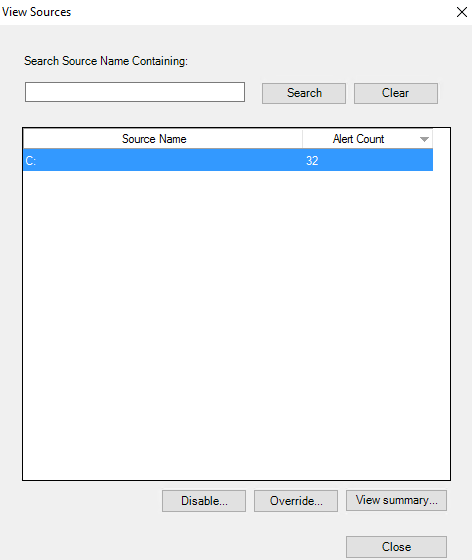
ANd lastly there is the option to “View or overrides sources” which will open up a popup where you can see which instances of the targetted class (here Logical Disk) have caused the alerts.
From here we can tune the selected monitor for the specific objects which caused the alerts.
As I said at the start of the article, these are screenshots on TP5 preview and there may be changes to come to the interface and possibilities presented here.
The idea is however very clear and I like that this will help a lot of SCOM admins move into the tuning of alerts easier and quicker. Some people know how to do this using available reports both from the default reports or third party reports packs, but this new feature opens this up for more regular use by more SCOM admins.
One more remark here: I tried to fool around with another monitor to force it to give lots of alerts and what happens? Another monitor causes alerts and the one I set to very low thresholds never even fired an alert. ha ha ha ha ha ha. 😀 😀 😀
Back to the SCOM 2016 Features – Overview post!
Happy tuning!
Bob Cornelissen